121 East 22nd StreetRecorded sales & closing prices
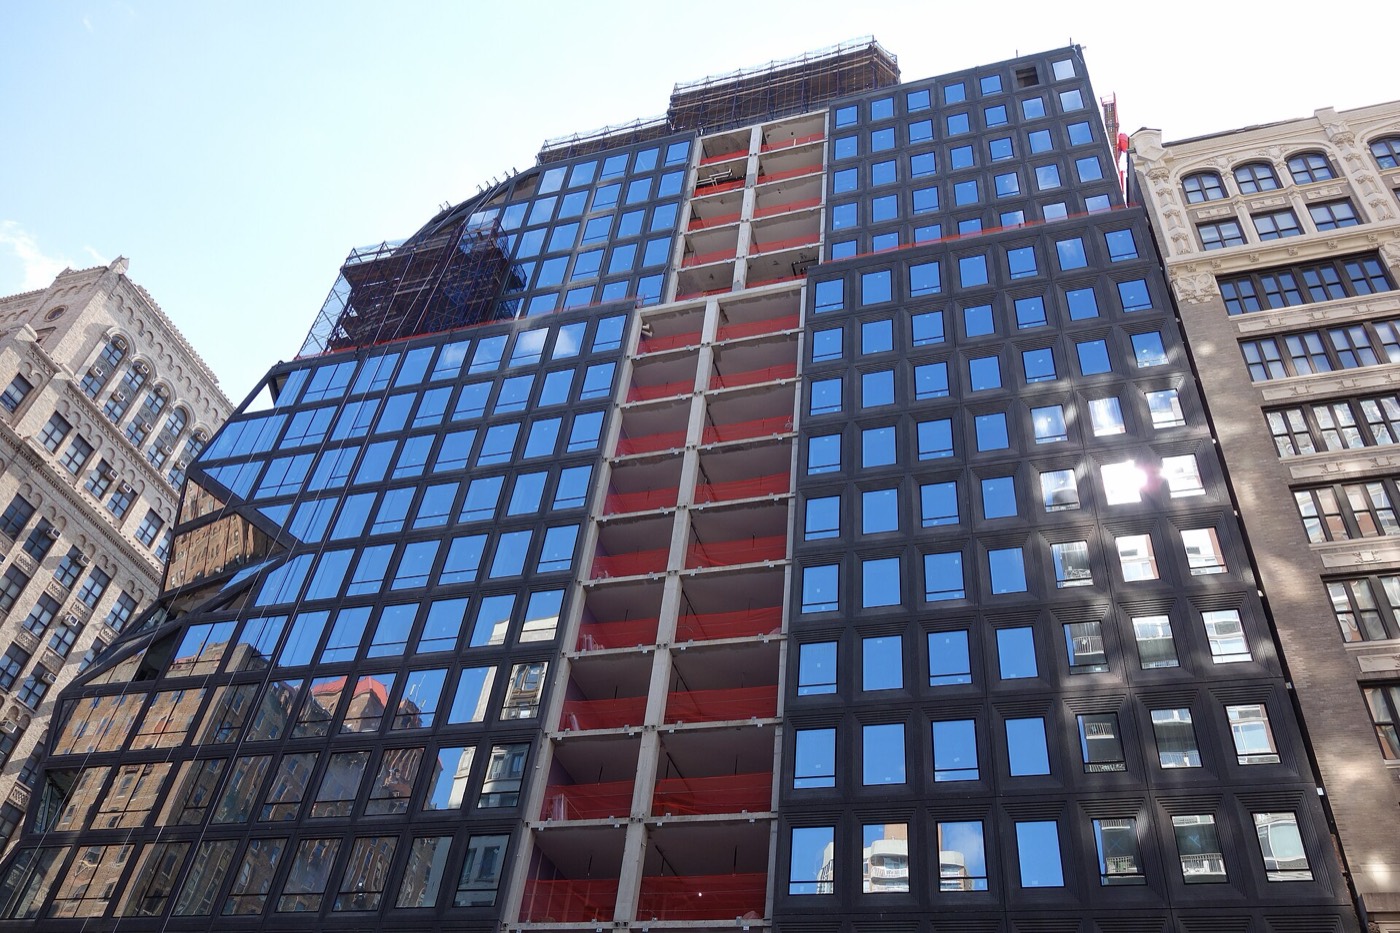
121 East 22nd Street, New York, NY 10010
153 recorded closings, 2019–2026. Sortable and searchable below.
- Recorded closings
- 153
- Date range
- 2019–2026
- Median $/sf
- $1,864
- Listing discount
- 0.0%
- Monthly carry/sf
- $3.35
- Price range
- $1.09M – $9.5M
Change in the building’s median $/sf over each window, from the raw yearly medians — too few standardized single-line units here to adjust to a constant-quality (average-floor) basis, so which apartments happened to trade moves these alongside price. (2022 marks the rate-shock inflection.) Like-for-like repeat-sale figures to follow.
The complete recorded-sale history for 121 East 22nd Street, compiled from NYC Department of Finance transfer records and verified listing data, then enriched apartment-by-apartment by The Roebling Team research desk.
Price per square foot over time
148 sales with a known square footage, by closing date.
Recent closings
The building’s 10 most recent market sales.
| Date | Unit | Apartment | Price | $/sf | vs. Ask |
|---|---|---|---|---|---|
| May 13, 2026 | N1505 | 2 BR · 2.5 BA · 1,678 sf | $3,425,000 | $2,041 | -2.1% |
| Apr 13, 2026 | N908 | 2 BR · 2 BA · 1,402 sf | $2,365,000 | $1,687 | -18.4% |
| Dec 18, 2025 | N307 | 1 BA · 735 sf | $1,200,000 | $1,633 | — |
| Oct 23, 2025 | N1405 | 1 BR · 1.5 BA · 1,123 sf | $1,950,000 | $1,736 | -2.5% |
| May 22, 2025 | N1504 | 1 BR · 1.5 BA · 1,128 sf | $1,990,000 | $1,764 | -20.4% |
| Apr 21, 2025 | N501 | 2 BR · 2.5 BA · 1,349 sf | $2,300,000 | $1,705 | -7.8% |
| Dec 16, 2024 | N202 | 1 BR · 1 BA · 812 sf | $1,525,000 | $1,878 | — |
| Jul 18, 2024 | N1005 | 1 BR · 1 BA · 788 sf | $1,800,000 | $2,284 | -2.7% |
| Jan 18, 2024 | 1505 | 2 BR · 2.5 BA | $3,530,000 | -10.6% | |
| Jan 18, 2024 | N1505 | 2 BR · 2.5 BA · 1,678 sf | $3,530,000 | $2,104 | — |
The retrade record
Lines that have changed hands more than once in the public record — the building’s appreciation arc, apartment by apartment. Showing the 24 strongest of 34 repeat-trade lines; sort the table below by Unit to see every line’s full history.
Every recorded sale
Sort any column; filter by unit or keyword. Prices are the recorded transfer amount at the NYC Department of Finance. Every sale sits in one of three states: counted in the building’s medians and trend; shown but excluded as a non-arms-length or nominal transfer; or shown and ⚑ flagged for review — a possible duplicate filing or an extreme $/sf outlier, held out of the statistics pending manual verification rather than allowed to move them.
| Apartment | ||||||
|---|---|---|---|---|---|---|
| May 13, 2026 | N1505 | 2 BR · 2.5 BA | 1,678 | $3,425,000 | $2,041 | -2.1% |
| Apr 13, 2026 | N908 | 2 BR · 2 BA | 1,402 | $2,365,000 | $1,687 | -18.4% |
| Dec 18, 2025 | N307 | 1 BA | 735 | $1,200,000 | $1,633 | — |
| Oct 23, 2025 | N1405 | 1 BR · 1.5 BA | 1,123 | $1,950,000 | $1,736 | -2.5% |
| May 22, 2025 | N1504 | 1 BR · 1.5 BA | 1,128 | $1,990,000 | $1,764 | -20.4% |
| Apr 21, 2025 | N501 | 2 BR · 2.5 BA | 1,349 | $2,300,000 | $1,705 | -7.8% |
| Dec 16, 2024 | N202 | 1 BR · 1 BA | 812 | $1,525,000 | $1,878 | — |
| Jul 18, 2024 | N1005 | 1 BR · 1 BA | 788 | $1,800,000 | $2,284 | -2.7% |
| Jan 18, 2024 | 1505 | 2 BR · 2.5 BA | — | $3,530,000 | — | -10.6% |
| Jan 18, 2024 | N1505 | 2 BR · 2.5 BA | 1,678 | $3,530,000 | $2,104 | — |
| Aug 10, 2023 | SPH | 4 BR · 4.5 BA | 3,248 | $6,500,000 | $2,001 | -20.2% |
| May 4, 2023 | S | 3 BR · 3.5 BA | 2,422 | $4,995,000 | $2,062 | -12.4% |
| Mar 15, 2023 | N | 2 BR · 2.5 BA | 1,678 | $3,075,000 | $1,833 | -19.6% |
| Mar 10, 2023 | N902 | 2 BR · 2.5 BA | 1,674 | $2,999,500 | $1,792 | -6.3% |
| Feb 2, 2023 | N802 | 2 BR · 2.5 BA | 1,674 | $2,850,000 | $1,703 | -10.2% |
| Jan 27, 2023 | N901 | 2 BR · 2.5 BA | 1,353 | $2,400,000 | $1,774 | -6.8% |
| Dec 9, 2022 | N907 | 2 BR · 2.5 BA | 1,707 | $2,900,000 | $1,699 | -14.1% |
| Nov 8, 2022 | N1304 | 5 BR · 5.5 BA | 3,798 | $9,450,000 | $2,488 | -14.1% |
| Oct 12, 2022 | N1505 | 2 BR · 2.5 BA | 1,678 | $3,865,000 | $2,303 | -7.0% |
| Oct 6, 2022 | N701 | 2 BR · 2.5 BA | 1,353 | $2,400,000 | $1,774 | -16.2% |
| Sep 29, 2022 | N801 | 2 BR · 2.5 BA | 1,353 | $2,428,258 | $1,795 | -16.3% |
| May 26, 2022 | N908Sponsor Sale | 2 BR · 2 BA | 1,402 | $3,055,000 | $2,179 | +0.0% |
| Apr 19, 2022 | N1302 | 4 BR · 4.5 BA | 2,655 | $6,204,835 | $2,337 | -16.5% |
| Feb 13, 2022 | N1605 | 2 BR · 2.5 BA | 1,678 | $3,990,000 | $2,378 | -5.0% |
| Feb 4, 2022 | N606 | 3 BR · 3.5 BA | 2,498 | $4,567,500 | $1,828 | -8.5% |
| Jan 27, 2022 | N503 | 1 BA | 616 | $1,391,500 | $2,259 | +6.2% |
| Jan 12, 2022 | N1101 | 2 BR · 2.5 BA | 1,353 | $2,805,000 | $2,073 | -6.7% |
| Dec 16, 2021 | N1002Sponsor Sale | 2 BR · 2.5 BA | 1,674 | $3,730,000 | $2,228 | +0.0% |
| Dec 12, 2021 | N1102 | 2 BR · 2.5 BA | 1,674 | $3,470,000 | $2,073 | -8.0% |
| Sep 29, 2021 | N807 | 2 BR · 2.5 BA | 1,707 | $3,350,000 | $1,963 | -8.8% |
| Aug 31, 2021 | N501 | 2 BR · 2.5 BA | 1,349 | $2,400,000 | $1,779 | -14.1% |
| Jun 23, 2021 | N1004Sponsor Sale | 1 BR · 1 BA | 780 | $1,825,000 | $2,340 | +0.0% |
| Jun 3, 2021 | N1107Sponsor Sale | 2 BR · 2.5 BA | 1,707 | $3,780,000 | $2,214 | +0.0% |
| May 14, 2021 | N402 | 2 BR · 2.5 BA | 1,674 | $2,879,815 | $1,720 | — |
| May 14, 2021 | N402Sponsor Sale | 2 BR · 2.5 BA | 1,674 | $2,879,814 | $1,720 | — |
| May 11, 2021 | N401 | 2 BR · 2.5 BA | 1,349 | $2,250,000 | $1,668 | -18.5% |
| May 9, 2021 | N1202 | 2 BR · 2.5 BA | 1,674 | $3,448,050 | $2,060 | -9.5% |
| Apr 22, 2021 | N301 | 2 BR · 2.5 BA | 1,349 | $2,288,211 | $1,696 | -16.0% |
| Apr 20, 2021 | N702Sponsor Sale | 1,674 | $2,990,000 | $1,786 | — | |
| Apr 19, 2021 | N602 | 2 BR · 2.5 BA | 1,674 | $2,898,805 | $1,732 | -18.8% |
| Apr 7, 2021 | NPH3 | 3 BR · 3.5 BA | 2,328 | $6,310,000 | $2,710 | -9.9% |
| Mar 31, 2021 | N302 | 2 BR · 2.5 BA | 1,674 | $2,825,644 | $1,688 | — |
| Mar 31, 2021 | N302Sponsor Sale | 2 BR · 2.5 BA | 1,674 | $2,825,643 | $1,688 | — |
| Feb 26, 2021 | N707 | 2 BR · 2.5 BA | 1,707 | $3,100,000 | $1,816 | -13.2% |
| Feb 9, 2021 | N1602 | 3 BR · 3.5 BA | 1,855 | $4,000,000 | $2,156 | -13.7% |
| Feb 4, 2021 | N601Sponsor Sale | 2 BR · 2.5 BA | 1,353 | $2,540,000 | $1,877 | — |
| Jan 7, 2021 | N1003Sponsor Sale | 1 BA | 616 | $1,325,000 | $2,151 | — |
| Oct 29, 2020 | N1503 | 3 BR · 3.5 BA | 2,052 | $4,459,680 | $2,173 | -11.3% |
| Sep 24, 2020 | N806Sponsor Sale | 3 BR | 2,483 | $4,752,015 | $1,914 | — |
| Sep 24, 2020 | N1208 | 2 BR · 2 BA | 1,402 | $2,907,000 | $2,073 | -8.0% |
| Aug 20, 2020 | N906 | 3 BR · 3.5 BA | 2,402 | $4,600,000 | $1,915 | -7.1% |
| Jul 20, 2020 | N406 | 2 BR · 2.5 BA | 1,750 | $3,390,625 | $1,938 | -8.0% |
| Jul 8, 2020 | NPH1Sponsor Sale | 3 BR · 3.5 BA | 3,046 | $9,500,000 | $3,119 | +0.0% |
| Jun 30, 2020 | N604Sponsor Sale | 1 BR · 1 BA | 780 | $1,725,000 | $2,212 | — |
| May 12, 2020 | N1502 | 3 BR · 3.5 BA | 1,855 | $4,215,000 | $2,272 | -9.1% |
| Apr 14, 2020 | NT607 | 2 BR · 2.5 BA | 1,707 | $3,270,000 | $1,916 | -8.4% |
| Apr 7, 2020 | N607 | 2 BR · 2.5 BA | 1,707 | $3,270,000 | $1,916 | -8.4% |
| Mar 10, 2020 | N808 | 2 BR · 2 BA | 1,402 | $2,864,540 | $2,043 | -5.1% |
| Mar 10, 2020 | N808 | 2 BR · 2 BA | 1,402 | $2,864,541 | $2,043 | -5.1% |
| Feb 25, 2020 | N904Sponsor Sale | 1 BR · 1 BA | 780 | $1,800,000 | $2,308 | +0.0% |
| Feb 25, 2020 | N508 | 2 BR⚑ Flagged for review — Possible duplicate filing of the same recorded sale — held out so it counts once | 1,707 | $3,190,000 | $1,869 | +0.0% |
| Feb 12, 2020 | N708Sponsor Sale | 2 BR · 2 BA | 1,402 | $2,790,000 | $1,990 | +0.0% |
| Feb 5, 2020 | N508 | 2 BR · 2.5 BA | 1,707 | $3,190,000 | $1,869 | -10.6% |
| Jan 31, 2020 | N505 | 1 BR · 1 BA | 791 | $1,713,200 | $2,166 | +0.2% |
| Dec 20, 2019 | N1301Sponsor Sale | 1 BR · 1.5 BA | 933 | $2,294,320 | $2,459 | +2.0% |
| Dec 20, 2019 | N1301 | 1 BR · 1.5 BA | 933 | $2,294,321 | $2,459 | +2.0% |
| Nov 20, 2019 | N1006Sponsor Sale | 3 BR · 3.5 BA | 2,481 | $5,150,000 | $2,076 | — |
| Nov 5, 2019 | N1206Sponsor Sale | 3 BR · 3.5 BA | 2,493 | $5,600,000 | $2,246 | +0.0% |
| Oct 30, 2019 | N404Sponsor Sale | 1 BR · 1 BA | 780 | $1,604,201 | $2,057 | — |
| Oct 30, 2019 | N404 | 1 BR · 1 BA | 780 | $1,604,202 | $2,057 | — |
| Oct 3, 2019 | N706Sponsor Sale | 3 BR · 3.5 BA | 2,504 | $5,147,846 | $2,056 | -5.0% |
| Oct 1, 2019 | N1103Sponsor Sale | 1 BA | 616 | $1,464,447 | $2,377 | +5.0% |
| Sep 26, 2019 | N1704Sponsor Sale | 1 BR · 1.5 BA | 1,128 | $2,482,697 | $2,201 | +2.0% |
| Sep 5, 2019 | N703Sponsor Sale | 1 BA | 616 | $1,384,820 | $2,248 | +1.8% |
| Sep 3, 2019 | N509Sponsor Sale | 2 BR · 2 BA | 1,402 | $2,721,985 | $1,942 | +1.9% |
| Sep 3, 2019 | N509 | 2 BR · 2 BA | 1,402 | $2,721,986 | $1,942 | +1.9% |
| Aug 16, 2019 | N408Sponsor Sale | 1,707 | $3,151,483 | $1,846 | — | |
| Aug 16, 2019 | N408 | 1,707 | $3,151,484 | $1,846 | — | |
| Jul 30, 2019 | NPH2Sponsor Sale | 3 BR · 4 BA | 2,727 | $8,044,175 | $2,950 | -5.4% |
| Jul 8, 2019 | N1703Sponsor Sale | 3 BR · 3.5 BA | 2,140 | $5,269,443 | $2,462 | -1.2% |
| Jul 3, 2019 | N1604Sponsor Sale | 1 BR · 1.5 BA | 1,128 | $2,355,212 | $2,088 | -2.3% |
| Jun 28, 2019 | NSponsor Sale | 1 BR · 1 BA | 788 | $1,853,215 | $2,352 | +7.7% |
| Jun 28, 2019 | N608Sponsor Sale | 2 BR · 2 BA | 1,402 | $2,790,005 | $1,990 | -5.4% |
| Jun 26, 2019 | N409Sponsor Sale | 2 BR · 2 BA | 1,402 | $2,637,267 | $1,881 | +1.8% |
| Jun 25, 2019 | N1702Sponsor Sale | 3 BR · 3.5 BA | 1,855 | $4,811,231 | $2,594 | +1.8% |
| Jun 21, 2019 | N1106Sponsor Sale | 3 BR · 3.5 BA | 2,505 | $5,396,725 | $2,154 | -3.4% |
| Jun 19, 2019 | N1701Sponsor Sale | 1 BR · 1.5 BA | 933 | $2,163,781 | $2,319 | +1.8% |
| Jun 13, 2019 | N1201Sponsor Sale | 2 BR · 2.5 BA | 1,353 | $3,040,000 | $2,247 | +0.0% |
| Jun 7, 2019 | N1405Sponsor Sale | 1 BR · 1.5 BA | 1,123 | $2,403,070 | $2,140 | +1.8% |
| Jun 6, 2019 | N1601Sponsor Sale | 1 BR · 1.5 BA | 933 | $2,189,237 | $2,346 | +1.8% |
| May 30, 2019 | N1603Sponsor Sale | 3 BR · 3.5 BA | 2,086 | $5,238,821 | $2,511 | +1.6% |
| May 23, 2019 | N1501Sponsor Sale | 1 BR · 1.5 BA | 933 | $2,163,781 | $2,319 | +1.8% |
| May 22, 2019 | N1401Sponsor Sale | 1 BR · 1.5 BA | 933 | $2,112,868 | $2,265 | +1.8% |
| May 22, 2019 | N1401 | 1 BR · 1.5 BA | 933 | $2,112,869 | $2,265 | +1.8% |
| May 22, 2019 | N1705Sponsor Sale | 2 BR · 2.5 BA | 1,678 | $4,220,646 | $2,515 | -0.6% |
| May 21, 2019 | N1403Sponsor Sale | 1 BR · 1.5 BA | 987 | $2,163,781 | $2,192 | +1.8% |
| May 20, 2019 | N304 | 1 BR · 1 BA | 780 | $1,578,288 | $2,023 | +5.6% |
| May 20, 2019 | N304Sponsor Sale | 1 BR · 1 BA | 780 | $1,578,287 | $2,023 | +5.6% |
| May 20, 2019 | N1504Sponsor Sale | 1 BR · 1.5 BA | 1,128 | $2,428,526 | $2,153 | +1.8% |
| May 16, 2019 | N1303Sponsor Sale | 1 BR · 1.5 BA | 999 | $2,367,431 | $2,370 | +1.8% |
| May 16, 2019 | N1305 | 3 BR · 3.5 BA | 2,316 | $5,941,489 | $2,565 | -0.8% |
| May 16, 2019 | N1305Sponsor Sale | 3 BR · 3.5 BA | 2,316 | $5,941,488 | $2,565 | -0.8% |
| May 13, 2019 | N1204Sponsor Sale | 1 BR · 1 BA | 780 | $1,837,941 | $2,356 | +1.8% |
| May 10, 2019 | N307Sponsor Sale | 1 BA | 735 | $1,374,637 | $1,870 | +1.8% |
| May 10, 2019 | N307 | 1 BA | 735 | $1,374,638 | $1,870 | +1.8% |
| May 7, 2019 | N1203Sponsor Sale | 1 BA | — | $1,486,645 | — | +1.8% |
| May 2, 2019 | N309Sponsor Sale | 2 BR · 2 BA | 1,402 | $2,510,000 | $1,790 | -12.2% |
| Apr 30, 2019 | N1104 | 1 BR · 1 BA | 780 | $1,786,011 | $2,290 | +1.8% |
| Apr 30, 2019 | N1104Sponsor Sale | 1 BR · 1 BA | 780 | $1,786,010 | $2,290 | +1.8% |
| Apr 29, 2019 | N1105 | 1 BR · 1 BA | 788 | $1,802,303 | $2,287 | +1.8% |
| Apr 29, 2019 | N1105Sponsor Sale | 1 BR · 1 BA | 788 | $1,802,302 | $2,287 | +1.8% |
| Apr 29, 2019 | N308Sponsor Sale | 1,707 | $3,065,000 | $1,796 | — | |
| Apr 26, 2019 | N1005Sponsor Sale | 1 BR · 1 BA | 788 | $1,776,846 | $2,255 | +1.8% |
| Apr 25, 2019 | N1205Sponsor Sale | 1 BR · 1 BA | 788 | $1,827,758 | $2,319 | +1.8% |
| Apr 25, 2019 | N1205 | 1 BR · 1 BA | 788 | $1,827,759 | $2,319 | +1.8% |
| Apr 24, 2019 | N803 | 1 BA | 616 | $1,318,634 | $2,141 | +1.8% |
| Apr 24, 2019 | N803Sponsor Sale | 1 BA | 616 | $1,318,633 | $2,141 | +1.8% |
| Apr 17, 2019 | N903Sponsor Sale | 1 BA | 616 | $1,395,002 | $2,265 | +1.8% |
| Apr 17, 2019 | N903 | 1 BA | 616 | $1,395,003 | $2,265 | +1.8% |
| Apr 15, 2019 | N205Sponsor Sale | 1 BR · 1 BA | 757 | $1,456,097 | $1,924 | +1.8% |
| Apr 15, 2019 | N205 | 1 BR · 1 BA | 757 | $1,456,098 | $1,924 | +1.8% |
| Apr 12, 2019 | N705 | 1 BR · 1 BA | 788 | $1,700,478 | $2,158 | +1.8% |
| Apr 12, 2019 | N705Sponsor Sale | 1 BR · 1 BA | 788 | $1,700,477 | $2,158 | +1.8% |
| Apr 11, 2019 | N502 | 2 BR · 2.5 BA | 1,674 | $3,538,419 | $2,114 | +0.2% |
| Apr 11, 2019 | N502Sponsor Sale | 2 BR · 2.5 BA | 1,674 | $3,538,418 | $2,114 | +0.2% |
| Apr 8, 2019 | N805Sponsor Sale | 1 BR · 1 BA | 788 | $1,751,390 | $2,223 | +1.8% |
| Apr 4, 2019 | N506Sponsor Sale | 2 BR · 2.5 BA | 1,728 | $3,568,328 | $2,065 | -3.6% |
| Apr 4, 2019 | N506 | 2 BR · 2.5 BA | 1,728 | $3,568,329 | $2,065 | -3.6% |
| Apr 4, 2019 | N704Sponsor Sale | 1 BR · 1 BA | 780 | $1,674,003 | $2,146 | +1.8% |
| Apr 1, 2019 | N804Sponsor Sale | 1 BR · 1 BA | 780 | $1,734,079 | $2,223 | +1.8% |
| Apr 1, 2019 | N804 | 1 BR · 1 BA | 780 | $1,734,080 | $2,223 | +1.8% |
| Apr 1, 2019 | N204Sponsor Sale | 1 BA | 773 | $1,486,645 | $1,923 | +1.8% |
| Mar 29, 2019 | N306Sponsor Sale | 2 BR · 2.5 BA | 1,773 | $3,453,250 | $1,948 | -5.0% |
| Mar 28, 2019 | N504Sponsor Sale | 1 BR · 1 BA | 780 | $1,630,218 | $2,090 | +1.8% |
| Mar 25, 2019 | N206 | 2 BR · 2 BA | 1,293 | $2,596,538 | $2,008 | +1.8% |
| Mar 25, 2019 | N206Sponsor Sale | 2 BR · 2 BA | 1,293 | $2,596,537 | $2,008 | +1.8% |
| Mar 21, 2019 | N507 | 1 BA | 735 | $1,374,638 | $1,870 | +1.8% |
| Mar 21, 2019 | N507Sponsor Sale | 1 BA | 735 | $1,374,637 | $1,870 | +1.8% |
| Mar 18, 2019 | N407Sponsor Sale | 1 BA | — | $1,400,093 | — | +1.8% |
| Mar 18, 2019 | N407 | 1 BA | — | $1,400,094 | — | +1.8% |
| Mar 15, 2019 | N403 | 1 BA | 616 | $1,170,988 | $1,901 | +1.8% |
| Mar 15, 2019 | N403Sponsor Sale | 1 BA | 616 | $1,170,987 | $1,901 | +1.8% |
| Mar 15, 2019 | N603Sponsor Sale | 1 BA | 616 | $1,359,363 | $2,207 | +1.8% |
| Mar 15, 2019 | N603 | 1 BA | 616 | $1,359,364 | $2,207 | +1.8% |
| Mar 14, 2019 | N605Sponsor Sale | 1 BR · 1 BA | 788 | $1,736,116 | $2,203 | +1.8% |
| Mar 8, 2019 | N202Sponsor Sale | 1 BR · 1 BA | 812 | $1,552,831 | $1,912 | +1.8% |
| Mar 7, 2019 | N405Sponsor Sale | 1 BR · 1 BA | 791 | $1,680,000 | $2,124 | +0.0% |
| Mar 6, 2019 | N203 | 613 | $1,094,619 | $1,786 | +1.8% | |
| Mar 6, 2019 | N203Sponsor Sale | 613 | $1,094,618 | $1,786 | +1.8% | |
| Feb 27, 2019 | N303Sponsor Sale | 1 BA | 616 | $1,170,987 | $1,901 | — |
| Feb 27, 2019 | N303 | 1 BA | 616 | $1,170,988 | $1,901 | — |
| Feb 21, 2019 | N305Sponsor Sale | 1 BR · 1 BA | 791 | $1,650,000 | $2,086 | +0.0% |
| Feb 12, 2019 | S2Sponsor Sale | 2 BR · 2.5 BA | 1,688 | $3,640,000 | $2,156 | — |
Sales sourced from NYC Department of Finance recorded transfers (BBL 1-00878-7501) and verified listing data. Apartment-level facts (line, condition, asking-price context) curated and cross-verified by The Roebling Team research desk. Not all transactions cross-verify with ACRIS records — sponsor and LLC purchases sometimes record at stipulated values rather than market price; square footage from recorded condo declarations and offering plans. Storage, parking, and commercial units are excluded from all figures. Floor- and line-level $/sf are time-controlled (each sale measured against the building’s going rate at the time of sale) and expressed at today’s pricing, so they isolate the floor or line premium rather than blend two decades of market movement.
Put this data to work.
Know what’s fair before you offer — we’ll show you where each line trades, the building’s discount-to-ask pattern, and where the value sits right now.
Price to the building’s real trajectory, not a guess — we’ll position your line against its true comps to maximize the outcome.