
Press & media coverage.
The Roebling Team and Corey Cohen in the press — feature coverage, market commentary, and interviews across Manhattan real estate, design, and finance media. A full media kit for journalists — bios, a headshot, downloadable Roebling Index data, and current research angles — follows below the coverage.

Expiring Property Tax Breaks Are About to Make New York Even More Expensive
September 22, 2026“When a tax benefit expires, the additional cost has to be absorbed somewhere — through higher rents where regulation and the market permit, lower net income for the landlord or, over time, a lower property value.”

Nearly 5K NYC Buildings to Lose Abatements by End of Decade
September 23, 2026
NYC Property Tax Bills Surge as Building Abatements Expire
September 23, 2026- citybiz
Simone Development Signs 36,000 SF in Mount Vernon Industrial Leases
August 28, 2026 
Gowanus Golf Club Secures 6K SF to Open Private Club in Brooklyn's Dumbo
July 27, 2026“Dumbo's continued residential growth, particularly at the luxury end of the market, has created a natural audience for premium, membership-driven concepts.”

Inman Announces the 2026 Inman Innovators Award Finalists
July 20, 2026
NYC Contracts: One of 1122 Madison's last availabilities leads Manhattan deals; Brooklyn Heights townhouse is borough's priciest of 2026
July 13, 2026“The latest contract at 1122 Madison Avenue comes at a time when, as Corey Cohen of Compass put it, one can practically watch the next cycle of Upper East Side residences being underwritten in real time as buyers show a willingness to pay for new construction, spacious layouts, and the freedoms that come with condo ownership.”
If StreetEasy shuts off tomorrow, do you still have a business?
May 14, 2026
How Mamdani's Win Is Roiling New York's Real Estate Market
2025Stealth NY's 67 West Street Lease Ranks Among NYC's Top Retail Deals
September 2025Streetwear Label Stealth Takes 5K SF at Greenpoint's 67 West Street
August 2025How Trump's Tariffs Could Squeeze New York's Real Estate Market
2025Casa Tua's Bushwick Lease Ranks Among NYC's Top Retail Leases
October 2024Private Club and Restaurant Casa Tua Opens 3K-SF Warehouse in Brooklyn
September 2024
StreetEasy Experts: Top 5 Highest-Priced Transactions, Sell-Side
2023Brooklyn Campervans Signs 7K-SF Lease in East Williamsburg, Brooklyn
November 2023Fabrication Studio Millwright Relocates to Bushwick
May 2023
The Only Reason We Got It Was That I Lied
October 2022Assessments 101: What They Mean for Homeowners and Buyers + Listings with Incentives to Offset Costs
Read →
How Can I Make a Co-op Board Disclose the Building's Financial Information?
Read →
The Roebling Group Leases 25,000 SF to Patina Rentals
Read →
‘I have to leave’: New Yorkers Face Record High Rents
Read →
Corey Cohen — Agent Profile
Read →
For journalists.


646.939.7375
Corey Cohen is a real estate agent affiliated with Compass. Compass is a licensed real estate broker and abides by Equal Housing Opportunity laws.
Corey Cohen is Principal of The Roebling Team at Compass and publisher of The Roebling Index, a research and data platform covering New York City buildings, transactions and market conditions. Over more than thirteen years he has completed 325 transactions representing more than $400 million in volume. His practice centers on Manhattan's cooperative and condominium market, including Park Avenue, Fifth Avenue, Central Park West, the Upper East Side, Upper West Side, Tribeca and West Chelsea.
Corey Cohen is Principal of The Roebling Team at Compass and publisher of The Roebling Index, a research and data platform covering New York City buildings, transactions and market conditions. Over more than thirteen years he has completed 325 transactions representing more than $400 million in volume, advising buyers and sellers on valuation, pricing strategy, negotiation and complex deal execution. His work is grounded in building-level analysis: property-tax schedules, carrying costs, building finances and regulatory obligations affect what an apartment is worth and how it should be positioned. The Index draws on more than 580,000 recorded transactions across Manhattan, Brooklyn and Queens, including more than 370,000 sales meeting its published eligibility standards, and publishes borough, neighborhood and corridor price measurements alongside thousands of public building profiles. Cohen also publishes The Roebling Report, a column on New York City housing and building governance, and is a Licensed Associate Real Estate Broker.
A proprietary index of New York apartment pricing — median condo price per square foot and co-op price per room, Manhattan-wide, across Brooklyn and Queens, by neighborhood, and along the named Park and avenue corridors — computed from 370,000+ index-eligible sales screened out of 580,000+ recorded transactions. Series run from 2004; small samples are suppressed rather than smoothed. Latest release: September 2026.
Exact figures, latest release: 372,943 index-eligible sales screened from 581,501 recorded transactions across 57,978 buildings in Manhattan, Brooklyn and Queens. The Manhattan-below-96th-Street subset, where a Manhattan-only figure is required, is 253,455 eligible sales across 13,239 buildings. 3,315 buildings carry dedicated public research profiles.Four dates govern these figures and they are not the same. The release is v7.2, generated September 2026; the source-data cutoff is August 2026. Every change window ends at full-year 2025, the last complete year — no percentage on this site is measured to a partial year. Some price levels are stated on a rolling 24-month basis that runs through the latest recorded trade, and therefore into 2026; each row on the Index says which basis it is on.
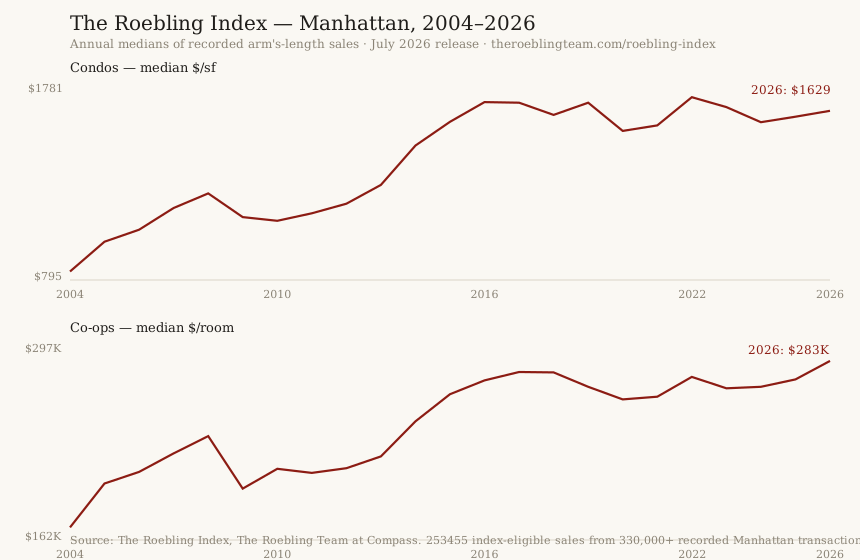
Underlying source: Roebling Index analysis of New York City Department of Finance and ACRIS records.
Suggested citation: “The Roebling Index, The Roebling Team at Compass” with a link to theroeblingteam.com/roebling-index. Custom cuts of the data are available on request.
An evidence-first estimate of a Manhattan apartment’s value, built from the subject building’s own comparable record — same-line and same-bedroom sales first, the neighborhood only when necessary, and the unit’s own prior sale as an anchor where one exists. The methodology was backtested against more than 220,000 historical Manhattan sales, with every estimate computed only from records dated before the sale it predicts; rules were adopted only when they improved out-of-sample accuracy, and the methodology file logs the rejected rules alongside the adopted ones.
On its largest validated segments the median error runs roughly 10–11%, shown to users as explicit ranges rather than false precision. About 86% of validated historical cases receive an on-screen estimate; the rest — townhouses, penthouses, thin records, $4M+ co-ops — route to a personally reviewed analysis instead of an automated number.
The Manhattan co-op $/room median is −1% since 2022 and flat since 2016; the condo $/sf median is −6% and −4% over the same windows, measured to full-year 2025. Neither segment has recovered its 2022 level — the relative-value segment simply gave back less than the trophy segment.
Measured on the rate-shock window, since full-year 2022: Brooklyn condo $/sf is +5% (3,248 eligible sales at the 2022 anchor) and Queens condo +6% (1,037), against Manhattan condo at −6% (6,332). Over the longer decade window since 2016 — a different measurement, spanning years before the rate shock — Brooklyn condo is +29% nominal and Queens +30%, against Manhattan at −4%. The divergence is the observation; that the brownstone, waterfront and close-in Queens markets absorbed the repricing better than Manhattan's core is our reading of it, not something these medians establish on their own.
The Queens co-op $/room median is +37% nominal since 2016, or +2% in real terms after inflation — the only parent-market series in the Index that is positive on an inflation-adjusted basis. Every Manhattan parent market is negative in real terms over the same window, most of them by more than 20%. At the neighborhood level the pattern repeats: of the 18 published neighborhood series that beat inflation since 2016, 16 are in Brooklyn or Queens.
Measured to full-year 2025 against the Index's standing 2016 anchor, 18 of the 87 published neighborhood series are positive in real terms: ten in Brooklyn, six in Queens, two in Manhattan. Bedford-Stuyvesant condominiums are the most durable of them — +49.6% nominal and +11.6% after inflation, and positive in real terms against every anchor year from 2014 through 2018, on annual samples of 148 to 239 recorded sales. Nominal prices recovered across most of the city; purchasing power did not.
Lincoln Square condo $/sf is −10% since 2022 while the Upper West Side overall is −7% — resales competing with two decades of new-development supply along the Broadway and Riverside corridors.
UES co-ops are +3% since 2022, on 2,071 eligible sales at the 2022 anchor, and +6% over the past year on 1,586. UES condos are flat since 2022 (842) and +5% over the past year (706). The full UES co-op series spans 36,056 index-eligible sales since 2004 — the corpus, not the sample behind either move.
Figures from The Roebling Index (September 2026 release), through the latest recorded sale; medians of recorded arm’s-length transactions, not asking prices. We can pull the underlying series for any of these on request.