220 Central Park SouthRecorded sales & closing prices
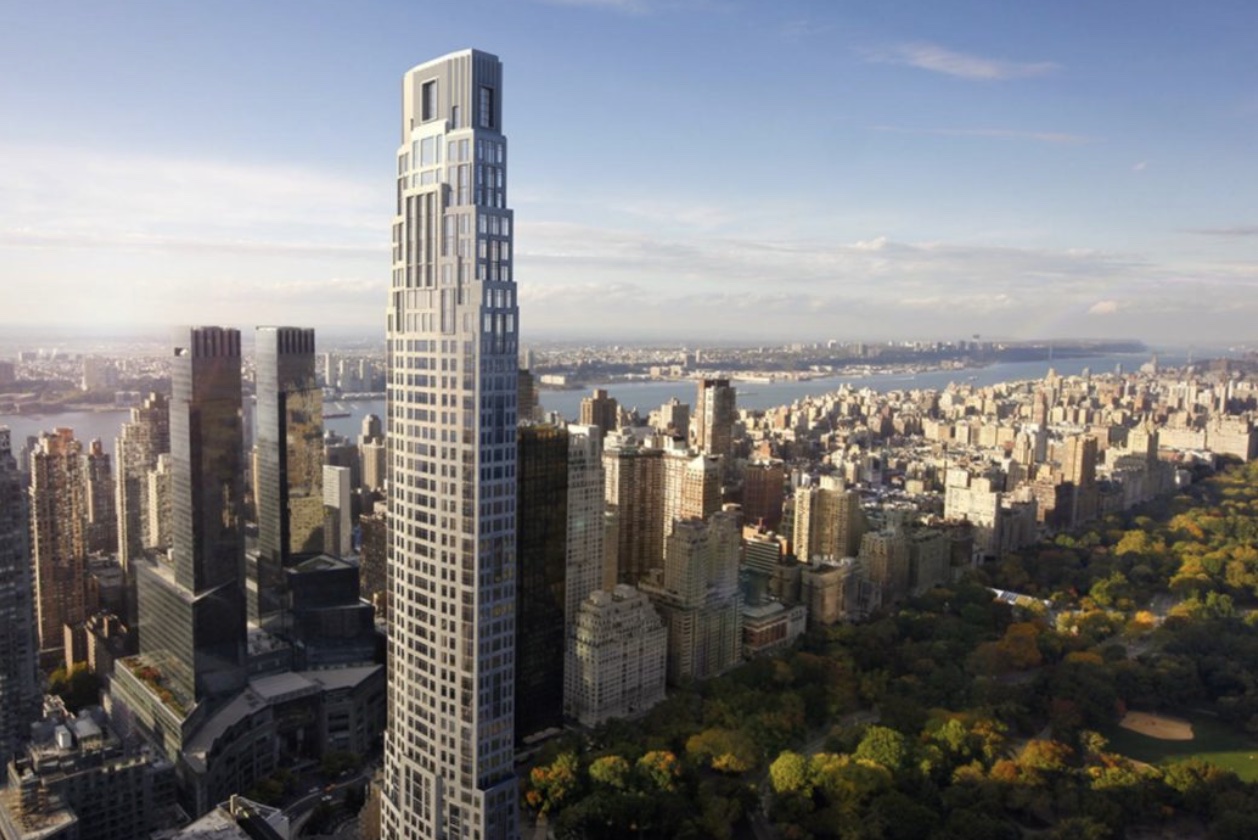
220 Central Park South, New York, NY 10019
124 recorded closings, 2018–2026. Sortable and searchable below.
- Recorded closings
- 124
- Date range
- 2018–2026
- Median $/sf
- $9,940
- Listing discount
- -1.8%
- Monthly carry/sf
- $6.67
- Price range
- $3.16M – $240M
Change in the building’s median $/sf over each window, adjusted to a constant-quality (average-floor) unit so it reflects price — not which floors happened to sell. (2022 marks the rate-shock inflection.) Like-for-like repeat-sale figures to follow.
The complete recorded-sale history for 220 CPS, compiled from NYC Department of Finance transfer records and verified listing data, then enriched apartment-by-apartment by The Roebling Team research desk.
Price per square foot over time
114 sales with a known square footage, by closing date.
The vertical premium
The climb in price per square foot as you rise through the building — light and views included, time-adjusted to today’s market.
Premium by line
What each line’s exposure is worth — its light, outlook, and orientation — measured against the building’s average sale.
Recent closings
The building’s 10 most recent market sales.
| Date | Unit | Apartment | Price | $/sf | vs. Ask |
|---|---|---|---|---|---|
| Feb 10, 2026 | 32A | 4 BR · 4.5 BA · 3,703 sfClosed Feb 2026 at $37.25M. High-floor corner unit with full Park views. | $37,250,000 | $10,059 | -4.5% |
| Dec 2, 2025 | 22C | 2 BR · 2.5 BA · 2,455 sfClosed November 17, 2025 at $13.29M — 1.55% under the $13.5M last asking. 2,455 sqft C-line configuration. | $13,290,165 | $5,414 | -1.6% |
| Oct 6, 2025 | 25A | 2 BR · 2.5 BA · 2,394 sfClosed Sep 24, 2025 at $16.15M — 7.71% under the $17.5M asking price. Same-day twin closing with 24A at the identical $16.15M; both 2,394 sqft 2BR A-line apartments. Direct floor-by-floor comp. | $16,150,000 | $6,746 | -7.7% |
| Oct 3, 2025 | 24A | 2 BR · 2.5 BA · 2,394 sfClosed Sep 24, 2025 at $16.15M — recorded transfer (same-day pair with 25A above). 2,394 sqft 2BR A-line. Provides a clean adjacent-floor benchmark within the building's lower trophy band. | $16,150,000 | $6,746 | — |
| May 7, 2025 | 44B | 3 BR · 3.5 BA · 3,043 sf | $36,500,000 | $11,995 | — |
| Apr 1, 2025 | 23C | 2 BR · 2.5 BA · 2,455 sf | $13,014,562 | $5,301 | -4.7% |
| Mar 13, 2025 | 19B | 973 sf | $6,300,000 | $6,475 | — |
| Mar 6, 2025 | 45A | 5 BR · 6.5 BA · 6,600 sfSeller: Byron Allen, the media-industry executive. Closed at $82.5M off-market — among NYC's largest 2025 residential sales. 6,600-sqft full-floor Central Park-facing residence in the A-line. | $82,500,000 | $12,500 | — |
| Feb 6, 2025 | 55B | 3 BR · 3.5 BA · 3,211 sfClosed Jan 29, 2025 at $35M — 6.67% under the $37.5M asking price. High-floor 3BR Tower configuration. The discount-to-ask range across 220 CPS's 2024–2026 resale wave clusters at -2% to -8%, materially tighter than the 53W53 / 432 Park supertall comps. | $35,000,000 | $10,900 | -6.7% |
| Jan 31, 2025 | 24C | 2,455 sf | $12,500,000 | $5,092 | — |
The retrade record
Lines that have changed hands more than once in the public record — the building’s appreciation arc, apartment by apartment.
Every recorded sale
Sort any column; filter by unit or keyword. Prices are the recorded transfer amount at the NYC Department of Finance. Every sale sits in one of three states: counted in the building’s medians and trend; shown but excluded as a non-arms-length or nominal transfer; or shown and ⚑ flagged for review — a possible duplicate filing or an extreme $/sf outlier, held out of the statistics pending manual verification rather than allowed to move them.
| Apartment | ||||||
|---|---|---|---|---|---|---|
| Feb 10, 2026 | 32A | 4 BR · 4.5 BAClosed Feb 2026 at $37.25M. High-floor corner unit with full Park views. | 3,703 | $37,250,000 | $10,059 | -4.5% |
| Dec 2, 2025 | 22C | 2 BR · 2.5 BAPrivate outdoor spaceClosed November 17, 2025 at $13.29M — 1.55% under the $13.5M last asking. 2,455 sqft C-line configuration. | 2,455 | $13,290,165 | $5,414 | -1.6% |
| Oct 6, 2025 | 25A | 2 BR · 2.5 BAClosed Sep 24, 2025 at $16.15M — 7.71% under the $17.5M asking price. Same-day twin closing with 24A at the identical $16.15M; both 2,394 sqft 2BR A-line apartments. Direct floor-by-floor comp. | 2,394 | $16,150,000 | $6,746 | -7.7% |
| Oct 3, 2025 | 24A | 2 BR · 2.5 BAClosed Sep 24, 2025 at $16.15M — recorded transfer (same-day pair with 25A above). 2,394 sqft 2BR A-line. Provides a clean adjacent-floor benchmark within the building's lower trophy band. | 2,394 | $16,150,000 | $6,746 | — |
| May 7, 2025 | 44B | 3 BR · 3.5 BA | 3,043 | $36,500,000 | $11,995 | — |
| Apr 1, 2025 | 23C | 2 BR · 2.5 BA | 2,455 | $13,014,562 | $5,301 | -4.7% |
| Mar 13, 2025 | 19B | 973 | $6,300,000 | $6,475 | — | |
| Mar 6, 2025 | 45A | 5 BR · 6.5 BASeller: Byron Allen, the media-industry executive. Closed at $82.5M off-market — among NYC's largest 2025 residential sales. 6,600-sqft full-floor Central Park-facing residence in the A-line. | 6,600 | $82,500,000 | $12,500 | — |
| Feb 6, 2025 | 55B | 3 BR · 3.5 BAClosed Jan 29, 2025 at $35M — 6.67% under the $37.5M asking price. High-floor 3BR Tower configuration. The discount-to-ask range across 220 CPS's 2024–2026 resale wave clusters at -2% to -8%, materially tighter than the 53W53 / 432 Park supertall comps. | 3,211 | $35,000,000 | $10,900 | -6.7% |
| Jan 31, 2025 | 24C | 2,455 | $12,500,000 | $5,092 | — | |
| Jan 21, 2025 | 24B | 3 BR · 3 BAPrivate outdoor space | 2,616 | $17,250,000 | $6,594 | -20.7% |
| Nov 20, 2024 | 39A | 3 BR · 3 BAClosed November 2024 at $32M — 7.25% under the $34.5M last asking. 3 BR / 3 BA / 3,100 sqft Central Park-facing A-line. | 3,100 | $32,000,000 | $10,323 | -7.2% |
| Jun 17, 2024 | 63 | non-market transfer (excluded from $/sf & trends) | — | $81,500,000 | — | — |
| Apr 17, 2024 | 43B | 3,043 | $33,000,000 | $10,845 | — | |
| Jan 2, 2024 | 22A | 2,394 | $10,637,228 | $4,443 | — | |
| Nov 22, 2023 | 64 | 5 BR · 5.5 BA | — | $75,000,000 | — | — |
| Oct 19, 2023 | 45A | 6,591 | $75,000,000 | $11,379 | — | |
| Aug 17, 2023 | 20E | non-market transfer (excluded from $/sf & trends) | — | $80,000,000 | — | — |
| May 4, 2023 | 19B | 973 | $5,000,000 | $5,139 | — | |
| Mar 14, 2023 | 22B | 2,616 | $14,800,875 | $5,658 | — | |
| Feb 27, 2023 | 37B | 3 BR · 3.5 BA | 3,043 | $33,800,000 | $11,107 | — |
| Nov 3, 2022 | PH75 | 5,021 | $72,000,000 | $14,340 | — | |
| Nov 3, 2022 | 19A | non-market transfer (excluded from $/sf & trends) | 917 | $3,000,000 | — | — |
| Jul 29, 2022 | 54B | 3 BR · 3.5 BA | 3,222 | $36,000,000 | $11,173 | — |
| Jan 19, 2022 | 27C | 2,455 | $14,800,875 | $6,029 | — | |
| Jan 6, 2022 | 38A | 3 BR · 1 BA | 3,114 | $32,000,000 | $10,276 | — |
| Jan 18, 2022 | PH73 | 4 BR · 5.5 BA⚑ Flagged for review — Outlier $/sf ($19,150 vs $8,138 building median) — pending manual verification | 9,817 | $188,000,000 | $19,150 | — |
| Dec 22, 2021 | 25C | 2,455 | $14,494,650 | $5,904 | — | |
| Oct 26, 2021 | 38B | 3,043 | $27,407,137 | $9,007 | — | |
| Oct 20, 2021 | V-11 | non-market transfer (excluded from $/sf & trends) | — | $66,000,000 | — | — |
| Sep 21, 2021 | 31A | 4 BR · 4.5 BAClosed Sep 8, 2021 at $33M — full asking price. Same A-line stack as the 32A Feb 2026 sale at $37.25M; the 5-year delta on the A-line (floors 31 → 32) provides ~13% nominal appreciation across approximately five years on near-identical configurations. | 3,703 | $33,000,000 | $8,912 | +0.0% |
| Sep 13, 2021 | 41B | 3,043 | $26,284,312 | $8,638 | — | |
| Aug 26, 2021 | 54A | 5 BA | 4,814 | $40,097,000 | $8,329 | — |
| Aug 18, 2021 | 54 | 4 BR · 5 BA | 4,814 | $49,500,000 | $10,283 | — |
| Aug 18, 2021 | 54/55A | 4 BR · 5 BA⚑ Flagged for review — Possible duplicate filing of the same recorded sale — held out so it counts once | 4,814 | $49,500,000 | $10,283 | — |
| Jun 9, 2021 | 67 | 5,935 | $59,500,000 | $10,025 | — | |
| Jun 5, 2021 | 60 | 4 BR · 5.5 BAnon-market transfer (excluded from $/sf & trends) | — | $82,500,000 | — | — |
| Jun 5, 2021 | 61 | 4 BR · 5.5 BA | 5,935 | $75,000,000 | $12,637 | — |
| Jun 2, 2021 | 36B | 3 BR · 3.5 BAPrivate outdoor space | 3,043 | $23,000,000 | $7,558 | -14.5% |
| May 27, 2021 | 29B | 2,455 | $16,076,812 | $6,549 | — | |
| May 4, 2021 | 55B | 3 BR · 3.5 BA | 3,211 | $33,000,000 | $10,277 | — |
| Dec 24, 2020 | 18D | 1,340 | $5,193,075 | $3,875 | — | |
| Nov 2, 2020 | V-10 | 3,956 | $40,000,000 | $10,111 | — | |
| Oct 17, 2020 | V-8 | 7,911 | $65,593,125 | $8,291 | — | |
| Sep 24, 2020 | 71 | 5,935 | $62,622,375 | $10,551 | — | |
| Oct 2, 2020 | 18B | 893 | $3,411,137 | $3,820 | — | |
| Oct 1, 2020 | 18A | 780 | $3,156,575 | $4,047 | — | |
| Sep 11, 2020 | 19B | 973 | $3,716,612 | $3,820 | — | |
| Sep 11, 2020 | 72 | 5,935 | $63,131,500 | $10,637 | — | |
| Sep 15, 2020 | 69 | 5,935 | $61,604,125 | $10,380 | — | |
| Aug 28, 2020 | 70 | 5,935 | $61,000,000 | $10,278 | — | |
| Aug 21, 2020 | V-3 | 4,896 | $30,500,000 | $6,230 | — | |
| Aug 18, 2020 | V-11 | 4,820 | $49,000,000 | $10,166 | — | |
| Aug 13, 2020 | 20B | 973 | $3,767,525 | $3,872 | — | |
| Aug 27, 2020 | V-7 | 4,946 | $40,730,000 | $8,235 | — | |
| Jul 27, 2020 | PH76 | 8,213 | $99,903,375 | $12,164 | — | |
| Jul 23, 2020 | 68 | 5,935 | $55,500,000 | $9,351 | — | |
| Jul 23, 2020 | 64 | 4 BR · 5.5 BA | 5,935 | $53,967,250 | $9,093 | -1.0% |
| Apr 21, 2020 | 65 | 4 BR · 5.5 BA | 5,935 | $56,258,312 | $9,479 | +1.8% |
| Apr 15, 2020 | 63 | 4 BR · 5.5 BA | 5,935 | $53,585,406 | $9,029 | -0.3% |
| Apr 22, 2020 | 60 | 4 BR · 5.5 BA | 5,935 | $50,912,500 | $8,578 | +1.8% |
| Apr 3, 2020 | 62 | 4 BR · 5.5 BA | 5,935 | $52,185,312 | $8,793 | +1.8% |
| Mar 19, 2020 | 40B | 3 BR · 3.5 BA | 3,043 | $22,910,625 | $7,529 | +1.8% |
| Mar 18, 2020 | 23A | 2 BR · 2.5 BA | 2,394 | $12,657,300 | $5,287 | +2.1% |
| Mar 10, 2020 | 61 | 4 BR · 5.5 BA | 5,935 | $51,421,625 | $8,664 | +1.8% |
| Mar 3, 2020 | 57B | 3 BR · 3.5 BA | 3,211 | $28,640,950 | $8,920 | +3.0% |
| May 7, 2020 | 58B | 3 BR · 3.5 BA | 3,191 | $26,779,975 | $8,392 | -5.7% |
| Dec 31, 2019 | 66 | 4 BR · 5.5 BA | 5,935 | $54,500,000 | $9,183 | -3.5% |
| Dec 23, 2019 | 20A | 1 BR · 1 BA | 917 | $3,818,437 | $4,164 | +1.8% |
| Dec 30, 2019 | 48A | 5 BR · 6.5 BA | 6,591 | $59,058,500 | $8,960 | +1.8% |
| Feb 5, 2020 | 56B | 3 BR · 3.5 BA | 3,222 | $28,001,875 | $8,691 | +1.8% |
| Dec 13, 2019 | 59A | 3 BR · 3.5 BA | 3,814 | $36,051,141 | $9,452 | -1.2% |
| Dec 17, 2019 | PH73 | 4 BR · 5.5 BA | 9,817 | $92,737,627 | $9,447 | +0.0% |
| Dec 17, 2019 | 55B | 3 BR · 3.5 BA | 3,211 | $26,786,500 | $8,342 | +3.0% |
| Dec 17, 2019 | 34A | 4 BR · 4.5 BA | 3,703 | $30,982,500 | $8,367 | +3.3% |
| Nov 26, 2019 | V-14 | — | $46,531,988 | — | — | |
| Nov 21, 2019 | VILLA | 1 BR · 1 BA | 4,340 | $46,531,989 | $10,722 | -1.0% |
| Nov 27, 2019 | 54B | 3 BR · 3.5 BA | 3,222 | $26,219,937 | $8,138 | +1.8% |
| Nov 25, 2019 | 46A | 6,591 | $59,567,625 | $9,038 | — | |
| Nov 12, 2019 | 49A | 5 BR · 6.5 BA | 6,591 | $64,149,750 | $9,733 | +1.8% |
| Oct 28, 2019 | 45A | 5 BR · 6.5 BA | 6,591 | $55,494,625 | $8,420 | -4.3% |
| Oct 31, 2019 | 47A | 5 BR · 6.5 BA | 6,591 | $61,000,000 | $9,255 | -3.2% |
| Oct 3, 2019 | 36B | 3 BR · 3.5 BA | 3,043 | $21,892,375 | $7,194 | +1.8% |
| Sep 26, 2019 | 56A | 4 BR · 5.5 BA | 4,814 | $41,748,250 | $8,672 | +1.8% |
| Oct 1, 2019 | 54A | 4 BR · 4.5 BA | 4,814 | $38,184,375 | $7,932 | +1.8% |
| Sep 25, 2019 | 58A | 2 BR · 2.5 BA | 2,431 | $18,500,000 | $7,610 | -7.5% |
| Aug 19, 2019 | 42B | 3 BR · 3.5 BA | 3,043 | $24,001,170 | $7,887 | +0.0% |
| Aug 2, 2019 | 39B | 3 BR · 3.5 BA | 3,043 | $24,107,850 | $7,922 | — |
| Jul 24, 2019 | 26C | 2 BR · 2.5 BA | 2,455 | $14,611,887 | $5,952 | +0.0% |
| Jul 26, 2019 | 37B | 3 BR · 3.5 BA | 3,043 | $22,197,850 | $7,295 | — |
| Jul 31, 2019 | 44B | 3 BR · 3.5 BA | 3,043 | $26,750,000 | $8,791 | -8.5% |
| Jul 29, 2019 | PH16 | 3 BR · 4.5 BA | 5,807 | $65,750,000 | $11,323 | -6.1% |
| Jul 9, 2019 | 34B | 2 BR · 1.5 BA | 2,455 | $16,037,437 | $6,533 | +1.8% |
| Jul 10, 2019 | 33B | 2 BR · 2.5 BA | 2,455 | $16,544,016 | $6,739 | +0.0% |
| Jun 27, 2019 | V-4 | 5 BR · 6.5 BA | 4,994 | $33,296,775 | $6,667 | -2.1% |
| Jun 17, 2019 | V-6 | 5 BR · 6.5 BA | 4,994 | $39,000,000 | $7,809 | -13.3% |
| Jun 3, 2019 | 31B | 2 BR · 2.5 BA | 2,455 | $16,546,562 | $6,740 | +1.8% |
| May 24, 2019 | 30B | 2 BR · 2.5 BA | 2,455 | $15,782,875 | $6,429 | — |
| May 16, 2019 | 28B | 2 BR · 2.5 BA | 2,455 | $15,782,875 | $6,429 | +1.8% |
| May 21, 2019 | 44A | 3 BR · 3.5 BA | 3,114 | $26,474,500 | $8,502 | -6.3% |
| May 13, 2019 | 43A | 3 BR · 3.5 BA | 3,114 | $25,456,250 | $8,175 | -9.1% |
| Apr 29, 2019 | 36A | 3 BR · 3.5 BA | 3,114 | $19,855,875 | $6,376 | +1.8% |
| Apr 8, 2019 | V-5 | — | $34,365,937 | — | — | |
| Apr 4, 2019 | VILLA | 5 BR · 6.5 BA | 4,994 | $34,365,938 | $6,881 | -0.4% |
| Apr 3, 2019 | 42A | 3 BR · 3.5 BA | 3,114 | $23,725,225 | $7,619 | +1.8% |
| Mar 11, 2019 | 41A | 3 BR · 3.5 BA | 3,114 | $23,419,750 | $7,521 | +1.8% |
| Mar 1, 2019 | 38A | 3 BR · 1 BA | 3,114 | $22,503,325 | $7,227 | +1.8% |
| Mar 25, 2019 | 40A | 3 BR · 3.5 BA | 3,114 | $23,386,675 | $7,510 | +3.0% |
| Mar 4, 2019 | 37A | 3 BR · 3.5 BA | 3,114 | $22,197,850 | $7,128 | +1.8% |
| Feb 22, 2019 | 39A | 3 BR · 3.5 BA | 3,114 | $22,808,800 | $7,325 | +1.8% |
| Feb 12, 2019 | 35A | 5 BR · 5.5 BA | 4,148 | $33,500,000 | $8,076 | — |
| Jan 25, 2019 | PH50 | 16 BR · 17.5 BAClosed Jan 23, 2019 at $239,958,219 — Ken Griffin's purchase of the 24,000+ sqft full-floor penthouse. The U.S. residential record at the time, and still the U.S. residential record as of 2026. Sets the absolute ceiling for the building and remains the single most-referenced data point in modern Manhattan luxury real estate. | 23,029 | $239,958,219 | $10,420 | -4.0% |
| Jan 9, 2019 | 33A | 4 BR · 4.5 BA | 3,703 | $30,191,112 | $8,153 | +1.8% |
| Dec 31, 2018 | 32A | 4 BR · 4.5 BA | 3,703 | $26,525,412 | $7,163 | +1.8% |
| Dec 18, 2018 | 29A | 4 BR · 4.5 BA | 3,703 | $28,483,062 | $7,692 | +0.8% |
| Dec 14, 2018 | 28A | 4 BR · 4.5 BA | 3,703 | $28,409,175 | $7,672 | +1.8% |
| Dec 18, 2018 | 30A | 4 BR · 4.5 BA | 3,703 | $29,121,950 | $7,864 | +1.8% |
| Dec 10, 2018 | 31A | 4 BR · 4.5 BA | 3,703 | $26,219,937 | $7,081 | +1.8% |
| Dec 7, 2018 | 26B | 3 BR · 3 BA | 2,616 | $17,819,375 | $6,812 | +1.8% |
| Nov 15, 2018 | 27A | 2 BR · 2.5 BA | 2,394 | $13,491,812 | $5,636 | +1.8% |
| Nov 8, 2018 | 26A | 2 BR · 2.5 BA | 2,394 | $13,339,075 | $5,572 | +1.8% |
| Oct 30, 2018 | 25A | 2 BR · 2.5 BA | 2,394 | $13,186,337 | $5,508 | +1.8% |
| Oct 24, 2018 | 24A | 2 BR · 2.5 BA | 2,394 | $11,857,219 | $4,953 | -7.4% |
| Oct 24, 2018 | 24B | 3 BR · 3 BA | 2,616 | $14,632,312 | $5,593 | -4.1% |
Sales sourced from NYC Department of Finance recorded transfers (BBL 1-01030-7501) and verified listing data. Apartment-level facts (line, condition, asking-price context) curated and cross-verified by The Roebling Team research desk. Not all transactions cross-verify with ACRIS records — sponsor and LLC purchases sometimes record at stipulated values rather than market price; square footage from recorded condo declarations and offering plans. Storage, parking, and commercial units are excluded from all figures. Floor- and line-level $/sf are time-controlled (each sale measured against the building’s going rate at the time of sale) and expressed at today’s pricing, so they isolate the floor or line premium rather than blend two decades of market movement.
Put this data to work.
Know what’s fair before you offer — we’ll show you where each line trades, the building’s discount-to-ask pattern, and where the value sits right now.
Price to the building’s real trajectory, not a guess — we’ll position your line against its true comps to maximize the outcome.