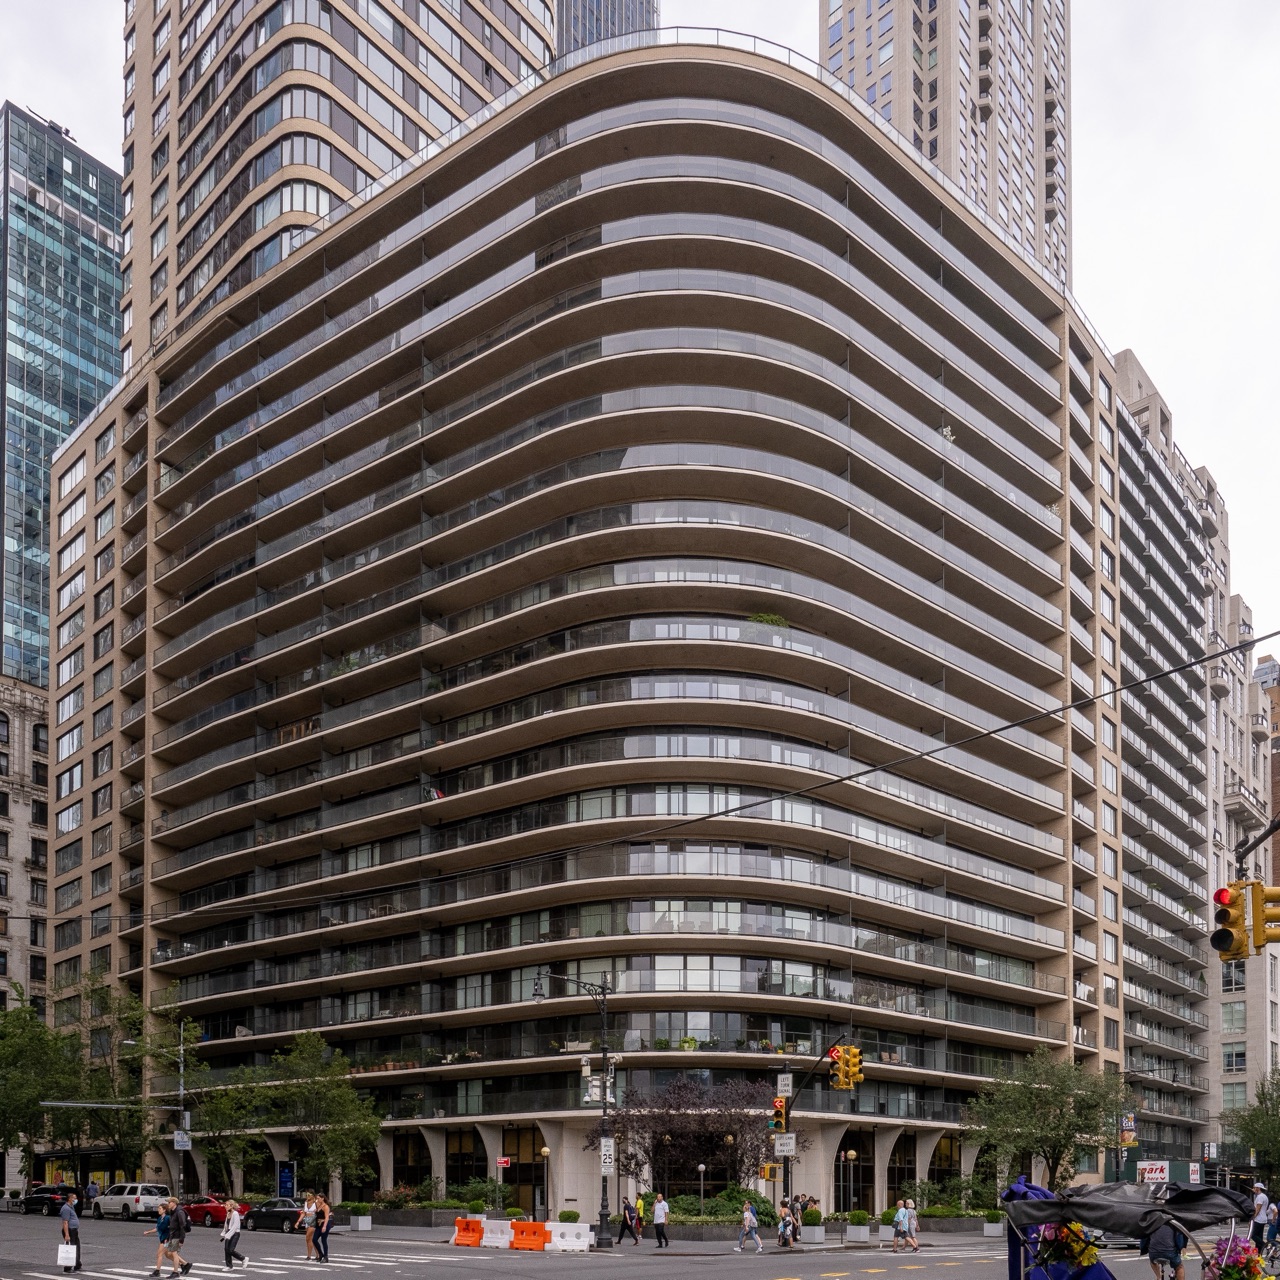
200 Central Park SouthRecorded sales & closing prices
200 Central Park South, New York, NY 10019
291 recorded transfers, 2002–2026. Sortable and searchable below.
- Recorded transfers
- 291
- Date range
- 2002–2026
- Median $/sf
- $1,480
- Listing discount
- 4.2%
- Monthly carry/sf
- $1.94
- Price range
- $500K – $12.3M
Change in the building’s median $/sf over each window, adjusted to a constant-quality (average-floor) unit so it reflects price — not which floors happened to sell. (2022 marks the rate-shock inflection.) Like-for-like repeat-sale figures to follow.
The complete recorded-sale history for 200 CPS, compiled from NYC Department of Finance transfer records and verified listing data, then enriched apartment-by-apartment by The Roebling Team research desk. Across sales with a public asking price, the building carries a median listing discount of 4.2% from the last ask — a recurring negotiation gap worth pricing into any offer or listing strategy here.
Price per square foot over time
188 sales with a known square footage, by closing date.
The vertical premium
The climb in price per square foot as you rise through the building — light and views included, time-adjusted to today’s market.
Premium by line
What each line’s exposure is worth — its light, outlook, and orientation — measured against the building’s average sale.
Recent closings
The building’s 10 most recent market sales.
| Date | Unit | Apartment | Price | $/sf | vs. Ask |
|---|---|---|---|---|---|
| Mar 5, 2026 | 24A | 3 BR · 2.5 BA · 2,100 sfClosed Mar 2, 2026 at $4.2M — 12% over the $3.75M asking. A 24th-floor A-line three-bedroom at 2,100 sqft = ~$2,000/sqft. Cleared meaningfully above ask, demonstrating renewed strength in the trophy-tier upper-floor segment at this CPS coop. | $4,200,000 | $2,000 | +12.0% |
| Mar 3, 2026 | 11K | 1 BA · 650 sfClosed Feb 26, 2026 at $875K — 5.81% under the $929K asking. An 11th-floor K-line studio at 650 sqft = ~$1,346/sqft. Entry-tier price band at 200 CPS. | $875,000 | $1,346 | -5.8% |
| Feb 24, 2026 | 11G | $1,675,000 | — | ||
| Feb 12, 2026 | 3F | 1 BR · 1 BA · 950 sf | $970,000 | $1,021 | -2.9% |
| Feb 4, 2026 | 3Q | 1 BR · 1.5 BA · 1,042 sf | $1,465,000 | $1,406 | -2.0% |
| Jan 12, 2026 | 7D | 1 BR · 2 BA · 1,050 sf | $2,500,000 | $2,381 | — |
| Jan 16, 2026 | 14A | 3 BR · 2.5 BA · 1,740 sfClosed Dec 11, 2025 at $2.9M — 3.17% under the $2.995M asking. A 14th-floor A-line three-bedroom at 1,740 sqft = ~$1,667/sqft. | $2,900,000 | $1,667 | -3.2% |
| Sep 16, 2025 | 5M | 1 BR · 1.5 BA · 1,100 sf | $1,295,000 | $1,177 | -7.2% |
| Jun 27, 2025 | 18B/C | 3 BR · 3 BA · 2,350 sfClosed Jun 13, 2025 at $6M — 6.25% under the $6.4M asking. An 18th-floor B/C-line combination at 2,350 sqft = ~$2,553/sqft. Mid-floor trophy three-bedroom configuration. | $6,000,000 | $2,553 | -6.3% |
| May 13, 2025 | 9Q | 2 BR · 2 BA · 1,050 sf | $1,675,000 | $1,595 | +1.5% |
Every recorded sale
Sort any column; filter by unit or keyword. Prices are the recorded transfer amount at the NYC Department of Finance. Every sale sits in one of three states: counted in the building’s medians and trend; shown but excluded as a non-arms-length or nominal transfer; or shown and ⚑ flagged for review — a possible duplicate filing or an extreme $/sf outlier, held out of the statistics pending manual verification rather than allowed to move them.
| Apartment | ||||||
|---|---|---|---|---|---|---|
| Mar 5, 2026 | 24A | 3 BR · 2.5 BAClosed Mar 2, 2026 at $4.2M — 12% over the $3.75M asking. A 24th-floor A-line three-bedroom at 2,100 sqft = ~$2,000/sqft. Cleared meaningfully above ask, demonstrating renewed strength in the trophy-tier upper-floor segment at this CPS coop. | 2,100 | $4,200,000 | $2,000 | +12.0% |
| Mar 3, 2026 | 11K | 1 BAClosed Feb 26, 2026 at $875K — 5.81% under the $929K asking. An 11th-floor K-line studio at 650 sqft = ~$1,346/sqft. Entry-tier price band at 200 CPS. | 650 | $875,000 | $1,346 | -5.8% |
| Feb 24, 2026 | 11G | — | $1,675,000 | — | — | |
| Feb 12, 2026 | 3F | 1 BR · 1 BA | 950 | $970,000 | $1,021 | -2.9% |
| Feb 4, 2026 | 3Q | 1 BR · 1.5 BA | 1,042 | $1,465,000 | $1,406 | -2.0% |
| Jan 12, 2026 | 7D | 1 BR · 2 BA | 1,050 | $2,500,000 | $2,381 | — |
| Jan 16, 2026 | 14A | 3 BR · 2.5 BAPrivate outdoor spaceClosed Dec 11, 2025 at $2.9M — 3.17% under the $2.995M asking. A 14th-floor A-line three-bedroom at 1,740 sqft = ~$1,667/sqft. | 1,740 | $2,900,000 | $1,667 | -3.2% |
| Sep 16, 2025 | 5M | 1 BR · 1.5 BA | 1,100 | $1,295,000 | $1,177 | -7.2% |
| Jun 27, 2025 | 18B/C | 3 BR · 3 BAClosed Jun 13, 2025 at $6M — 6.25% under the $6.4M asking. An 18th-floor B/C-line combination at 2,350 sqft = ~$2,553/sqft. Mid-floor trophy three-bedroom configuration. | 2,350 | $6,000,000 | $2,553 | -6.3% |
| May 13, 2025 | 9Q | 2 BR · 2 BA | 1,050 | $1,675,000 | $1,595 | +1.5% |
| May 13, 2025 | 17G | 2 BR · 2 BAPrivate outdoor space | 1,260 | $2,400,000 | $1,905 | — |
| Apr 14, 2025 | 10H | 1 BR · 1.5 BAPrivate outdoor space | 1,050 | $1,725,000 | $1,643 | -3.9% |
| Mar 24, 2025 | 8K | 1 BA | 650 | $830,000 | $1,277 | -15.2% |
| Mar 7, 2025 | 19K | 1 BA | — | $925,000 | — | -7.4% |
| Feb 14, 2025 | 7Q | 1 BR · 1 BA | 1,050 | $1,187,500 | $1,131 | — |
| Feb 4, 2025 | 15H | 1 BR · 1.5 BAPrivate outdoor space | 1,050 | $1,700,000 | $1,619 | -5.5% |
| Dec 2, 2024 | 3C | 1 BAPrivate outdoor space | 650 | $1,350,000 | $2,077 | +5.9% |
| Nov 7, 2024 | 17H | 1 BR · 1.5 BAPrivate outdoor space | 1,050 | $1,400,000 | $1,333 | — |
| Nov 8, 2024 | 9L | 1 BA | 650 | $663,000 | $1,020 | -4.6% |
| Oct 3, 2024 | 11F | 1 BA | 500 | $660,000 | $1,320 | -2.2% |
| Sep 20, 2024 | 19DEF | 3 BR · 4 BA⚑ Flagged for review — Outlier $/sf ($3,457 vs $1,267 building median) — pending manual verificationPrivate outdoor spaceClosed Sep 20, 2024 at $12.4M — 8.15% under the $13.5M asking. A 19th-floor D/E/F-line combination at 3,587 sqft = ~$3,457/sqft. Among the larger 200 CPS combinations in the modern dataset. | 3,587 | $12,400,000 | $3,457 | -8.1% |
| Sep 4, 2024 | 20G | 2 BR · 2 BAPrivate outdoor space | 1,260 | $2,288,000 | $1,816 | -4.2% |
| Aug 28, 2024 | 20DEF | 3 BR · 5 BA⚑ Flagged for review — Outlier $/sf ($3,358 vs $1,267 building median) — pending manual verificationPrivate outdoor spaceClosed Aug 21, 2024 at $12.307M — 8.84% under the $13.5M asking. A 20th-floor D/E/F-line combination at 3,665 sqft = ~$3,358/sqft. Three-bedroom configuration. | 3,665 | $12,307,250 | $3,358 | -8.8% |
| Aug 15, 2024 | 20C | 1 BA⚑ Flagged for review — Outlier $/sf ($3,138 vs $1,267 building median) — pending manual verificationPrivate outdoor space | 650 | $2,040,000 | $3,138 | -13.2% |
| Jul 23, 2024 | 5K | 1 BA | 650 | $717,500 | $1,104 | -4.2% |
| Jul 9, 2024 | 33A | 2 BR · 2.5 BAClosed Jul 10, 2024 at $4.388M — 7.02% over the $4.1M asking. A 33rd-floor A-line two-bedroom at 2,100 sqft = ~$2,089/sqft. High-floor positioning cleared above ask. | 2,100 | $4,388,000 | $2,090 | +7.0% |
| Mar 1, 2024 | 6P | — | $990,000 | — | — | |
| Jan 31, 2024 | 9Q | 2 BR · 2 BAnon-market transfer (excluded from $/sf & trends) | 1,050 | $975,000 | — | — |
| Jan 23, 2024 | 7C | 1 BAPrivate outdoor space | 650 | $1,300,000 | $2,000 | -7.1% |
| Jan 8, 2024 | 7K | 1 BA | 650 | $830,000 | $1,277 | -2.2% |
| Jan 18, 2024 | 10G | 2 BR · 2 BAPrivate outdoor space | 1,260 | $1,750,000 | $1,389 | -4.1% |
| Nov 21, 2023 | 17K | 1 BA | 650 | $790,000 | $1,215 | -1.1% |
| Oct 26, 2023 | 17B | 2 BR · 2.5 BAPrivate outdoor space | — | $4,100,000 | — | -26.8% |
| Sep 25, 2023 | 29AB | 3 BR · 3.5 BAnon-market transfer (excluded from $/sf & trends) | 3,550 | $1,100,000 | — | — |
| Sep 22, 2023 | 19C | 1 BA⚑ Flagged for review — Outlier $/sf ($3,538 vs $1,267 building median) — pending manual verification | 650 | $2,300,000 | $3,538 | -8.0% |
| Aug 9, 2023 | 8A | 2 BR · 2.5 BA | 1,740 | $2,817,000 | $1,619 | -6.0% |
| Jul 18, 2023 | S-30ABC | 4 BR · 4+ BAClosed Jul 12, 2023 at $12.95M (ACRIS recorded $10.38M for 30ABC on Jul 14, 2023; price discrepancy may reflect partial recording). A 30th-floor A/B/C-line combination at 5,250 sqft = ~$2,467/sqft. Among the largest combined units at 200 CPS. | 5,250 | $10,377,400 | $1,977 | -19.9% |
| Jul 6, 2023 | 14G | 2 BR · 2 BA | — | $1,750,000 | — | -5.4% |
| Jul 17, 2023 | 3I | 1 BR · 1 BA | 950 | $1,700,000 | $1,789 | — |
| Jul 21, 2023 | 15D | 1 BR · 1.5 BAPrivate outdoor space | 1,050 | $2,660,000 | $2,533 | -27.1% |
| Jun 8, 2023 | 19H | 1 BR · 1.5 BAPrivate outdoor space | 1,050 | $1,850,000 | $1,762 | — |
| May 2, 2023 | 19F | 1 BR · 1 BA | 950 | $1,050,000 | $1,105 | -12.5% |
| Mar 16, 2023 | 32A | 2 BR · 3 BAClosed Feb 27, 2023 at $5.123M — 2.45% over the $5M asking. A 32nd-floor A-line two-bedroom at 2,100 sqft = ~$2,440/sqft. | 2,100 | $5,122,600 | $2,439 | +2.5% |
| Jan 9, 2023 | 32B/C | 3 BR · 3.5 BAClosed Dec 29, 2022 at $6.1M — at the $6.1M asking. A 32nd-floor B/C-line combination — clean clearing trade at the upper-floor mid-tier. | — | $6,100,000 | — | +0.0% |
| Jan 5, 2023 | 6K | 1 BA | — | $668,000 | — | -3.9% |
| Dec 14, 2022 | 11H | 1 BR · 2 BAPrivate outdoor space | 1,050 | $2,150,000 | $2,048 | -4.4% |
| Sep 15, 2022 | 18E | — | $920,000 | — | — | |
| Mar 28, 2023 | 32A | 2 BR · 3 BA | 2,100 | $2,105,000 | $1,002 | — |
| Jun 21, 2022 | 16B | 2 BR · 2.5 BAPrivate outdoor space | 1,700 | $4,200,000 | $2,471 | -6.7% |
| Jun 17, 2022 | 14P | 2 BR · 2 BAPrivate outdoor space | 1,250 | $2,738,000 | $2,190 | -8.6% |
| Jun 9, 2022 | 7I | 1 BR · 1 BAPrivate outdoor space | 950 | $1,300,000 | $1,368 | -7.1% |
| Apr 22, 2022 | 10R | 2 BR · 2 BA | 1,450 | $1,980,000 | $1,366 | -19.2% |
| Apr 7, 2022 | 28A | 2 BR · 2.5 BA | — | $4,500,000 | — | -4.3% |
| Apr 7, 2022 | 18A | 2 BR · 2.5 BAPrivate outdoor space | 1,740 | $2,885,000 | $1,658 | -9.7% |
| Apr 13, 2022 | 11P | 1 BR · 1.5 BA | — | $1,150,000 | — | — |
| Mar 24, 2022 | 6M | — | $995,000 | — | — | |
| Mar 25, 2022 | 19B | 2 BR · 2 BAPrivate outdoor space | — | $4,950,000 | — | -23.8% |
| Feb 23, 2022 | 4H | 1 BR · 1.5 BAPrivate outdoor space | 1,050 | $1,350,000 | $1,286 | — |
| Feb 16, 2022 | 3H | 1 BR · 2 BAPrivate outdoor space | — | $1,395,000 | — | -3.5% |
| Dec 9, 2021 | 6C | 1 BAPrivate outdoor space | 650 | $1,300,000 | $2,000 | +4.9% |
| Nov 18, 2021 | 16G | 2 BR · 2 BAPrivate outdoor space | 1,350 | $2,047,500 | $1,517 | -6.9% |
| Oct 19, 2021 | 9H | 1 BR · 1.5 BA | 1,050 | $1,500,000 | $1,429 | — |
| Oct 19, 2021 | 14L | 1 BA | 625 | $675,000 | $1,080 | — |
| Sep 29, 2021 | 7H | 1 BR · 2 BAPrivate outdoor space | 1,050 | $2,185,000 | $2,081 | -12.6% |
| Sep 20, 2021 | 11H | 1 BR · 1.5 BAPrivate outdoor space | 1,050 | $1,476,462 | $1,406 | -4.7% |
| Oct 8, 2021 | 6D | 1 BR · 2 BAPrivate outdoor space | 1,050 | $2,650,000 | $2,524 | -11.5% |
| Aug 4, 2021 | 21F | — | $605,000 | — | — | |
| Jul 19, 2021 | 21L | 1 BA | — | $660,000 | — | -3.6% |
| Jul 8, 2021 | 8P | 1 BR · 1.5 BA | 1,100 | $1,365,000 | $1,241 | -2.2% |
| Jun 29, 2021 | 9I10I | 2 BR · 2.5 BA | 1,650 | $2,250,000 | $1,364 | -18.2% |
| Jun 29, 2021 | 12J | 1 BR · 2 BAPrivate outdoor space | 1,100 | $1,100,000 | $1,000 | -21.1% |
| Jun 25, 2021 | 1112I | 2 BR · 2 BA | — | $2,500,000 | — | -15.3% |
| Jun 22, 2021 | 12F | 1 BR | 950 | $975,000 | $1,026 | — |
| Jun 29, 2021 | 8M | 1 BR · 1.5 BA | 1,050 | $1,090,000 | $1,038 | -0.9% |
| Sep 28, 2023 | 24B | 2 BR · 3 BA | — | $2,550,000 | — | -8.9% |
| May 18, 2021 | 16K | 1 BA | 650 | $670,000 | $1,031 | -16.1% |
| May 20, 2021 | 31A | 2 BR · 2.5 BA | 2,100 | $4,200,000 | $2,000 | -9.7% |
| May 4, 2021 | 9A | 2 BR | 1,750 | $2,250,000 | $1,286 | — |
| Jul 1, 2022 | 3J | 1 BR · 1.5 BA | 1,100 | $1,100,000 | $1,000 | -7.4% |
| Apr 8, 2021 | 18F | 1 BR · 1 BA | — | $1,230,000 | — | -11.8% |
| Sep 23, 2020 | 6N | 1 BR · 1 BA | — | $825,000 | — | — |
| Mar 6, 2020 | 4I | 1 BR · 1 BAPrivate outdoor space | 950 | $1,299,000 | $1,367 | -3.7% |
| Feb 21, 2020 | 15F | 1 BR · 1 BA | 950 | $1,257,750 | $1,324 | -10.2% |
| Feb 25, 2020 | 8I | 1 BR · 1 BAPrivate outdoor space | — | $1,250,000 | — | -3.8% |
| Jan 28, 2020 | 10P | 1 BR · 1 BA | 675 | $967,337 | $1,433 | -15.9% |
| Nov 12, 2019 | 3P | 1 BR · 1.5 BA | 1,100 | $1,235,000 | $1,123 | -1.1% |
| Aug 30, 2019 | 11F | 1 BA | — | $699,000 | — | -6.7% |
| Aug 12, 2019 | 3D | 1 BR | 850 | $2,400,000 | $2,824 | — |
| Jul 31, 2019 | 15K | 1 BAPrivate outdoor space | 625 | $790,000 | $1,264 | -1.1% |
| Jul 23, 2019 | 6D | 2 BR · 2 BA⚑ Flagged for review — Outlier $/sf ($3,219 vs $1,267 building median) — pending manual verificationPrivate outdoor space | 1,050 | $3,380,000 | $3,219 | -3.4% |
| Jun 11, 2019 | 19C | 1 BA | — | $3,500,000 | — | — |
| May 9, 2019 | 20J | 2 BR · 2.5 BAPrivate outdoor space | 1,600 | $2,900,000 | $1,813 | -6.5% |
| Apr 22, 2019 | 7K | — | $749,000 | — | — | |
| Apr 2, 2019 | 11 | — | $2,800,000 | — | — | |
| Apr 2, 2019 | 12-J | 1 BR · 2 BA | 1,100 | $1,200,000 | $1,091 | — |
| Jan 3, 2019 | 18I | 2 BR · 2.5 BA | 1,800 | $2,872,000 | $1,596 | -4.1% |
| Sep 10, 2018 | 3Q | 1 BR · 1.5 BA | 1,042 | $1,240,000 | $1,190 | — |
| Aug 13, 2018 | 8L | 625 | $699,000 | $1,118 | — | |
| Jul 23, 2018 | 21E | 2 BR · 1.5 BAPrivate outdoor space | 1,750 | $3,300,000 | $1,886 | -15.3% |
| Apr 19, 2018 | 21G | 2 BR · 2 BAPrivate outdoor space | 1,350 | $2,260,000 | $1,674 | -13.9% |
| Apr 11, 2018 | 7R | 2 BR | 1,450 | $1,732,500 | $1,195 | -8.5% |
| Mar 30, 2018 | 20H | 1 BRPrivate outdoor space | 1,053 | $2,239,000 | $2,126 | -2.2% |
| Mar 28, 2018 | 4I | 1 BR | — | $1,277,000 | — | -3.6% |
| Jan 19, 2018 | 7I | 1 BR · 1 BA | 950 | $1,300,000 | $1,368 | — |
| Nov 3, 2017 | 5B | 2 BRPrivate outdoor space | 1,850 | $4,000,000 | $2,162 | -15.8% |
| Oct 20, 2017 | 27C | 2 BR | 1,600 | $3,563,875 | $2,227 | -5.0% |
| Oct 18, 2017 | 18F | 1 BR | — | $970,125 | — | -24.5% |
| Sep 19, 2017 | 19D | — | $7,000,000 | — | — | |
| Oct 2, 2017 | 11D | — | $1,375,000 | — | — | |
| Aug 11, 2017 | 14P | 2 BR · 2 BA⚑ Flagged for review — Outlier $/sf ($4,371 vs $1,267 building median) — pending manual verificationPrivate outdoor space | 700 | $3,060,000 | $4,371 | -4.2% |
| May 16, 2017 | 8N | 1 BR | 950 | $940,000 | $989 | -24.8% |
| Mar 31, 2017 | 11L | — | $661,962 | — | — | |
| Jul 13, 2016 | 3K | 625 | $615,000 | $984 | — | |
| Jul 22, 2016 | 12L | — | $820,000 | — | — | |
| Jun 27, 2016 | 4F | 1 BR · 1 BA | 950 | $941,000 | $991 | -12.5% |
| Jun 16, 2016 | 1617I | 2 BR | 1,800 | $2,600,000 | $1,444 | -13.2% |
| Jun 6, 2016 | 14L | 1 BA | 625 | $747,800 | $1,196 | -0.2% |
| Jul 18, 2016 | 25A | 3 BR | 2,100 | $5,800,000 | $2,762 | +17.2% |
| Jun 24, 2016 | 17K | 620 | $880,000 | $1,419 | -1.7% | |
| Feb 11, 2016 | 6B | 2 BRPrivate outdoor space | 1,800 | $3,700,000 | $2,056 | -1.3% |
| Jan 12, 2016 | 15A | 2 BR · 2.5 BA | 1,825 | $3,360,000 | $1,841 | -9.1% |
| Jan 30, 2016 | 3I | 1 BRPrivate outdoor space | 950 | $1,305,000 | $1,374 | -1.5% |
| Oct 14, 2015 | 19B | 2 BR · 2 BAClosed Oct 9, 2015 at $5M. Recorded transfer of a 19th-floor B-line — mid-2010s benchmark at 200 CPS. Useful long-arc reference: $5M in 2015; comparable 19B configurations in 2023 traded at $4.1M (-18% over 8 years — illustrative of the prewar CPS coop pricing arc into the 2022-2023 correction). | — | $5,000,000 | — | — |
| Sep 28, 2015 | 4K | 1 BA | — | $795,000 | — | — |
| Aug 31, 2015 | 12H | 1 BR · 1.5 BAPrivate outdoor space | 1,100 | $1,750,000 | $1,591 | -6.7% |
| May 13, 2015 | 11QR | 4 BRPrivate outdoor space | 2,700 | $3,700,000 | $1,370 | -2.6% |
| May 1, 2015 | 19D/E | — | $5,825,335 | — | — | |
| Apr 20, 2015 | 19D | — | $5,825,336 | — | — | |
| Dec 31, 2014 | 28C | 1 BR · 1.5 BAClosed Dec 23, 2014 at $3.004M — essentially at the $2.995M asking. A 28th-floor C-line one-bedroom — high-floor entry-tier configuration at 200 CPS. | 1,600 | $3,003,937 | $1,877 | +0.3% |
| Dec 24, 2014 | 10P | 1 BR · 1 BA | 675 | $845,000 | $1,252 | — |
| Aug 26, 2014 | 4G | 2 BR · 2 BAClosed Apr 29, 2014 at $2.1M — 5.26% over the $1.995M asking. A 4th-floor G-line two-bedroom that cleared above ask in early-2014 — strong cycle pricing for the mid-floor smaller-apartment tier. | 1,400 | $2,100,000 | $1,500 | +5.3% |
| Jul 11, 2014 | 15E/1 | — | $6,100,000 | — | — | |
| Jul 14, 2014 | 20H | 1 BR | 1,053 | $2,150,000 | $2,042 | — |
| Jun 24, 2014 | 7H | 1 BRPrivate outdoor space | 1,100 | $1,662,500 | $1,511 | +4.2% |
| Jun 20, 2014 | 10H | 1 BR | 1,050 | $1,725,000 | $1,643 | — |
| Jun 17, 2014 | 6D | 1 BR | — | $2,550,000 | — | -3.8% |
| Jun 10, 2014 | 20DEF | 4 BRPrivate outdoor space | — | $12,288,000 | — | -17.9% |
| May 20, 2014 | 15F | 1 BR · 1 BA | 950 | $1,290,312 | $1,358 | — |
| May 6, 2014 | 3F | 1 BRPrivate outdoor space | 950 | $896,060 | $943 | -0.3% |
| Apr 22, 2014 | 35A | 2 BR | 2,100 | $5,600,000 | $2,667 | — |
| May 21, 2014 | 6M | — | $800,000 | — | — | |
| Feb 4, 2014 | 10C | — | $695,000 | — | — | |
| Oct 28, 2013 | 29A/B | 3 BR · 3.5 BA | 3,550 | $7,000,000 | $1,972 | — |
| Sep 16, 2013 | 3I | 1 BRPrivate outdoor space | — | $1,200,000 | — | — |
| Sep 4, 2013 | 5B | 2 BRPrivate outdoor space | 1,850 | $4,350,000 | $2,351 | +14.6% |
| Aug 19, 2013 | 17J | 1 BR | — | $1,620,000 | — | +8.4% |
| Aug 21, 2013 | 15K | — | $600,000 | — | -1.6% | |
| Jun 25, 2013 | 7A | 3 BRPrivate outdoor space | — | $2,800,000 | — | +7.9% |
| May 31, 2013 | 3E | 3 BR | — | $2,945,000 | — | -9.4% |
| May 17, 2013 | 4I | 1 BR | — | $1,175,000 | — | -2.1% |
| May 16, 2013 | 12G | 2 BRPrivate outdoor space | 1,260 | $1,834,650 | $1,456 | -18.5% |
| May 23, 2013 | 9I10I | — | $2,685,000 | — | — | |
| Apr 29, 2013 | 4L | 1 BA | 620 | $725,000 | $1,169 | +3.7% |
| Mar 5, 2013 | 5E | 2 BR · 3.5 BAClosed May 23, 2013 (ACRIS recorded Feb 2013) at $2.85M — 4.84% under the $2.995M asking. A 5th-floor E-line two-bedroom — useful long-arc benchmark: $2.85M in 2013; comparable E-line two-bedrooms at 200 CPS now trading in the $1.5M-$2M range (smaller configurations). | — | $2,850,000 | — | -4.8% |
| Jan 3, 2013 | 3A | 3 BR · 2.5 BAPrivate outdoor space | 1,740 | $2,328,000 | $1,338 | -6.7% |
| Dec 20, 2012 | 15H | 1 BRPrivate outdoor space | — | $1,225,000 | — | -5.4% |
| Dec 13, 2012 | 7N | 1 BR | 950 | $875,000 | $921 | -7.9% |
| Dec 11, 2012 | 7Q | 1 BR | 1,053 | $1,042,500 | $990 | -9.3% |
| Nov 26, 2012 | 16C | 620 | $1,295,000 | $2,089 | — | |
| Nov 13, 2012 | 8F | 1 BR · 1 BA | 950 | $877,500 | $924 | -5.1% |
| Nov 1, 2012 | 6D | 1 BR | — | $2,300,000 | — | — |
| Oct 17, 2012 | 3P | 1 BR · 1.5 BA | 1,100 | $960,000 | $873 | +3.2% |
| Sep 20, 2012 | 16H | — | $1,725,000 | — | — | |
| Jun 29, 2012 | 23B | 2 BRPrivate outdoor space | 1,500 | $1,781,937 | $1,188 | -25.6% |
| May 17, 2012 | 15J | 2 BR | 1,200 | $1,191,742 | $993 | -14.6% |
| May 9, 2012 | 8M | 1 BR | 1,100 | $975,000 | $886 | — |
| Apr 17, 2012 | 14F | — | $587,000 | — | — | |
| Jan 31, 2012 | 19H | 1 BR · 1.5 BA | — | $1,608,835 | — | — |
| Dec 15, 2011 | 23C | 2 BR | 1,600 | $1,850,000 | $1,156 | -15.7% |
| Dec 6, 2011 | 19E | 1 BR · 1.5 BAnon-market transfer (excluded from $/sf & trends)Closed Oct 25, 2011 at $9.1M. Recorded transfer of a 19th-floor E-line — among the larger pre-2014 200 CPS trades in the modern dataset. Useful long-arc benchmark for the upper-floor E-line trajectory. | — | $9,100,000 | — | — |
| Dec 2, 2011 | 23B | 1 BR | 950 | $1,000,000 | $1,053 | — |
| Jul 19, 2011 | 11N | 1 BR | 950 | $850,000 | $895 | -2.9% |
| Jun 10, 2011 | 7A | 3 BRPrivate outdoor space | — | $2,350,000 | — | -6.0% |
| Mar 29, 2011 | 6-F | 1 BR | 950 | $875,000 | $921 | — |
| Mar 21, 2011 | 26B | 1 BR | 1,450 | $2,567,500 | $1,771 | -6.6% |
| Mar 7, 2011 | 7H | 1 BR · 2 BAPrivate outdoor space | 1,050 | $1,320,000 | $1,257 | -5.4% |
| Jan 4, 2011 | 34A | 2 BR | 2,200 | $4,325,000 | $1,966 | -13.5% |
| Sep 21, 2010 | 21L | 1 BA | 600 | $570,000 | $950 | -4.2% |
| Sep 16, 2010 | 17K | — | $625,000 | — | -3.7% | |
| Jun 21, 2010 | 14N | 1 BR | 900 | $695,000 | $772 | — |
| Jun 21, 2010 | 11R | 2 BR | 1,450 | $1,775,000 | $1,224 | — |
| Jun 21, 2010 | 8R | 2 BR | 1,450 | $1,495,000 | $1,031 | — |
| Jun 10, 2010 | 10R | 2 BR | 1,450 | $1,875,000 | $1,293 | — |
| May 14, 2010 | 17E | 2 BRPrivate outdoor space | 1,700 | $3,375,000 | $1,985 | — |
| Apr 30, 2010 | 3I | 1 BRPrivate outdoor space | — | $899,000 | — | — |
| Apr 8, 2010 | 8J | — | $1,100,000 | — | — | |
| Oct 4, 2012 | 14A | 2 BRPrivate outdoor space | — | $2,386,000 | — | -10.0% |
| Apr 5, 2010 | 9F | 1 BR | 950 | $830,000 | $874 | — |
| Feb 3, 2010 | 6D | 1 BR · 2 BAPrivate outdoor space | 1,050 | $1,850,000 | $1,762 | -2.6% |
| Nov 17, 2009 | 5M | 1 BR | 1,100 | $799,000 | $726 | — |
| Nov 16, 2009 | 6-I | 1 BR | 950 | $800,000 | $842 | -5.9% |
| Sep 25, 2009 | 8I | 1 BR · 1 BA | — | $999,000 | — | — |
| Aug 26, 2009 | 7Q | 1 BR | 1,053 | $875,000 | $831 | — |
| Jun 22, 2009 | 7D | 1 BRPrivate outdoor space | 1,100 | $1,900,000 | $1,727 | -4.8% |
| May 21, 2009 | 3N | 1 BR | 950 | $700,000 | $737 | -2.6% |
| May 7, 2009 | 10R | 2 BR | 1,450 | $1,775,000 | $1,224 | -5.3% |
| May 5, 2009 | 3H | 1 BR · 2 BAPrivate outdoor space | 1,100 | $995,000 | $905 | — |
| Mar 11, 2009 | 20H | 1 BRPrivate outdoor space | 1,100 | $1,525,000 | $1,386 | -1.6% |
| Oct 8, 2008 | 6E | 2 BR · 2.5 BAPrivate outdoor spaceClosed Oct 5, 2008 at $3.25M — at the $3.25M asking. A 6th-floor E-line two-bedroom recorded into the depths of the 2008 financial crisis — clean clearing trade despite the market disruption. Useful long-arc pre-crisis benchmark. | — | $3,250,000 | — | +0.0% |
| Sep 23, 2008 | 19J | 1 BR | 1,185 | $1,525,000 | $1,287 | -1.0% |
| Sep 12, 2008 | 20G | 2 BRPrivate outdoor space | — | $1,700,000 | — | -8.1% |
| Sep 10, 2008 | 14H | 1 BRPrivate outdoor space | 1,100 | $1,295,000 | $1,177 | — |
| Aug 7, 2008 | 3C | Private outdoor space | 650 | $999,000 | $1,537 | — |
| Jul 16, 2008 | 20D | — | $3,563,875 | — | — | |
| Jul 8, 2008 | 8N | 1 BR | — | $949,000 | — | — |
| Feb 19, 2008 | 11C | — | $1,250,000 | — | — | |
| Feb 7, 2008 | 16A | 3 BR | — | $3,875,000 | — | +6.2% |
| Jan 10, 2008 | 3G | 2 BRPrivate outdoor space | — | $1,522,500 | — | -2.7% |
| Dec 13, 2007 | 4I | 1 BRPrivate outdoor space | — | $995,000 | — | — |
| Oct 10, 2007 | 7H | 1 BR · 2 BA | 1,050 | $1,225,000 | $1,167 | — |
| Sep 10, 2007 | 16G | 2 BRPrivate outdoor space | 1,350 | $1,765,000 | $1,307 | -1.9% |
| Aug 27, 2007 | 21G | 2 BRPrivate outdoor spaceClosed Jul 23, 2007 at $1.68M. Recorded transfer of a 21st-floor G-line — 2007 pre-crisis cycle peak benchmark for the mid-floor smaller-apartment tier at 200 CPS. Useful long-arc reference point for measuring the building's price trajectory across the 2008-2023 disruption-and-recovery window. | 1,350 | $1,676,680 | $1,242 | -6.8% |
| Jun 28, 2007 | 12A | 2 BR | 1,740 | $2,695,000 | $1,549 | — |
| May 24, 2007 | 11-Q | 1 BR | 1,050 | $962,836 | $917 | +1.5% |
| May 17, 2007 | 21L | 1 BA | 600 | $650,000 | $1,083 | -3.7% |
| May 1, 2007 | 3Q | 1 BR · 1.5 BA | 1,042 | $820,000 | $787 | — |
| May 17, 2007 | 33C | — | $1,750,000 | — | — | |
| Apr 12, 2007 | 11K | 650 | $600,000 | $923 | — | |
| Apr 19, 2007 | 19J | 1 BR | 1,185 | $1,185,000 | $1,000 | -8.8% |
| Mar 7, 2007 | 4G | 2 BR | — | $1,300,000 | — | — |
| Apr 18, 2007 | 18F | 1 BR · 1 BA | — | $875,000 | — | — |
| Feb 26, 2007 | 33A | 2 BR | 2,100 | $3,425,000 | $1,631 | — |
| Dec 29, 2006 | 16C | 620 | $980,000 | $1,581 | — | |
| Oct 31, 2006 | 5B | 2 BRPrivate outdoor space | — | $2,202,750 | — | -9.2% |
| Nov 20, 2006 | 2J | 1 BR | — | $950,000 | — | -3.6% |
| Aug 24, 2006 | 18K | 650 | $620,000 | $954 | -0.8% | |
| Jul 14, 2006 | 9M | 1 BR | 1,100 | $949,000 | $863 | — |
| Jul 11, 2006 | 11I | 2 BR · 2 BA | — | $2,100,000 | — | — |
| Jul 7, 2006 | 34B | — | $2,345,000 | — | — | |
| Jun 15, 2006 | 3A | 3 BR | 1,740 | $2,209,603 | $1,270 | -1.8% |
| Apr 19, 2006 | 21L | 1 BA | 600 | $649,000 | $1,082 | — |
| Apr 21, 2006 | 17M | 3 BR | 2,200 | $1,680,112 | $764 | — |
| Mar 15, 2006 | 29B | 2 BR | 1,600 | $1,900,000 | $1,188 | -3.8% |
| Apr 24, 2006 | 17J | 1 BR | — | $1,100,000 | — | -4.3% |
| Mar 30, 2006 | 4M | 2 BR | 1,100 | $855,000 | $777 | -1.6% |
| Mar 14, 2006 | 12N | 1 BR | 950 | $769,000 | $809 | — |
| Mar 6, 2006 | 11N | 1 BR | 950 | $730,000 | $768 | — |
| Feb 27, 2006 | 7N | 1 BR | 950 | $680,000 | $716 | +0.7% |
| Feb 6, 2006 | 11B | 2 BRPrivate outdoor space | 1,850 | $3,000,000 | $1,622 | -6.3% |
| Jan 25, 2006 | 18 19 | 2 BR | 1,650 | $2,015,500 | $1,222 | +0.0% |
| Jan 24, 2006 | 8C | Private outdoor space | 650 | $730,000 | $1,123 | -2.7% |
| Nov 7, 2005 | 14P | 2 BRPrivate outdoor space | — | $2,139,037 | — | -1.7% |
| Nov 1, 2005 | 3P | 1 BR | 1,100 | $825,000 | $750 | — |
| Oct 19, 2005 | 12Q | 1 BR · 1.5 BA | 1,054 | $828,000 | $786 | — |
| Mar 17, 2006 | 11F | 1 BA | — | $500,000 | — | — |
| Sep 30, 2005 | 11R | 2 BRPrivate outdoor space | 1,450 | $1,700,000 | $1,172 | -4.2% |
| Sep 8, 2005 | 3I | 1 BR | — | $749,000 | — | — |
| Sep 7, 2005 | 14N | 1 BR | 900 | $695,000 | $772 | — |
| Aug 19, 2005 | 4I | 1 BR | — | $852,396 | — | +0.4% |
| Sep 13, 2005 | 8R | 2 BR | 1,450 | $1,440,000 | $993 | -3.7% |
| Sep 6, 2005 | 11D | — | $1,400,000 | — | — | |
| Aug 19, 2005 | 22C | — | $1,519,988 | — | — | |
| Aug 4, 2005 | 9H | 1 BRPrivate outdoor space | 1,050 | $1,175,000 | $1,119 | — |
| Aug 4, 2005 | 16H | — | $1,200,000 | — | — | |
| Jul 18, 2005 | 12F | 1 BR | 950 | $751,996 | $792 | +0.4% |
| Jun 2, 2005 | 18F | 1 BR · 1 BA | — | $725,000 | — | -3.3% |
| Jun 14, 2005 | 4C | Private outdoor space | 620 | $730,000 | $1,177 | -2.5% |
| May 20, 2005 | 29A | 2 BR | 2,100 | $3,500,000 | $1,667 | +0.1% |
| May 27, 2005 | 4D | 1 BR | 950 | $1,225,000 | $1,289 | -1.9% |
| Apr 28, 2005 | 3D | 1 BR | 850 | $975,000 | $1,147 | — |
| Jun 9, 2005 | 10C | — | $769,988 | — | — | |
| Apr 7, 2005 | 3G | 2 BR | — | $1,200,000 | — | — |
| Apr 5, 2005 | 5P | — | $795,000 | — | — | |
| Mar 24, 2005 | 5F | 1 BR | 900 | $680,000 | $756 | +3.8% |
| Mar 25, 2005 | 20G | 2 BRPrivate outdoor space | — | $1,225,000 | — | -9.3% |
| Mar 31, 2005 | 4E | 2 BRPrivate outdoor space | 2,000 | $1,900,000 | $950 | -11.6% |
| Jan 28, 2005 | 20A | 3 BR | — | $1,699,000 | — | — |
| Feb 22, 2005 | 34B | — | $1,837,941 | — | — | |
| Jan 12, 2005 | 21A | 2 BR | 1,740 | $1,807,230 | $1,039 | -2.3% |
| Dec 3, 2004 | 4C | 620 | $650,000 | $1,048 | -13.2% | |
| Nov 1, 2004 | 10H | 1 BR | 1,050 | $950,000 | $905 | — |
| Sep 1, 2004 | 20B | 2 BR | 1,850 | $2,959,000 | $1,599 | -1.2% |
| Sep 22, 2004 | 9F | 1 BR | 950 | $602,400 | $634 | — |
| Aug 3, 2004 | 4C | 620 | $650,000 | $1,048 | — | |
| Jun 18, 2004 | 8P | 1 BR · 1.5 BA | 1,100 | $795,000 | $723 | -3.6% |
| Jun 17, 2004 | 1030 | — | $795,000 | — | — | |
| Jun 15, 2004 | 8B | — | $3,600,000 | — | — | |
| Jun 10, 2004 | 12P | 1 BR | 1,050 | $750,000 | $714 | -2.5% |
| Jun 3, 2004 | 10R | 2 BR | 1,450 | $895,000 | $617 | — |
| Jun 2, 2004 | 12A | 2 BR | 1,740 | $1,549,000 | $890 | — |
| May 21, 2004 | 16F | 1 BR | 1,000 | $645,000 | $645 | -5.8% |
| Apr 22, 2004 | 11M | 1 BR | — | $795,000 | — | — |
| Feb 17, 2004 | 4H | 1 BR | — | $795,000 | — | -4.2% |
| Dec 3, 2003 | 16J | 1 BR | 1,185 | $945,000 | $797 | — |
| Dec 1, 2003 | 4M | 2 BR | 1,100 | $699,000 | $635 | — |
| Nov 14, 2003 | 14H | 1 BR | 1,100 | $849,000 | $772 | — |
| Oct 15, 2003 | 4D | 1 BR | 950 | $800,000 | $842 | — |
| Aug 20, 2003 | 24B | 2 BR | 1,450 | $1,300,000 | $897 | — |
| Jun 25, 2002 | 7H | 1 BR · 2 BA | 1,050 | $693,000 | $660 | -18.5% |
| 15H | 1 BR | — | $1,295,000 | — | — | |
| 4I | — | $1,175,000 | — | — |
Sales sourced from NYC Department of Finance recorded transfers (BBL 1-01030-0029) and verified listing data. Apartment-level facts (line, condition, asking-price context) curated and cross-verified by The Roebling Team research desk. Not all transactions cross-verify with ACRIS records — sponsor and LLC purchases sometimes record at stipulated values rather than market price; square footage on co-ops is not officially recorded, figures shown are approximate. Storage, parking, and commercial units are excluded from all figures. Floor- and line-level $/sf are time-controlled (each sale measured against the building’s going rate at the time of sale) and expressed at today’s pricing, so they isolate the floor or line premium rather than blend two decades of market movement.
Put this data to work.
Know what’s fair before you offer — we’ll show you where each line trades, the building’s discount-to-ask pattern, and where the value sits right now.
Price to the building’s real trajectory, not a guess — we’ll position your line against its true comps to maximize the outcome.