Downtown Brooklyn
Downtown Brooklyn is the 2004 rezoning made vertical: the borough's tallest residential towers now line the Flatbush Avenue corridor, and nearly every unit we track was built after 2005. Because the stock is this new, sale histories lean heavily on sponsor closings rather than resales, and early trading in a tower reflects the sponsor's pricing program as much as the market. Read resale comps separately from sponsor sales, and check each building's tax-abatement clock before modeling the carry.
What the index shows for Downtown Brooklyn
Median condominium price per square foot and cooperative price per room, January–August 2026, with the change from the same months of last year, over the last full year, and since 2022 and 2016. Condos are measured by the foot, co-ops by the room. Rents are the median annual rent per square foot, with the same-apartment change.
January–August 2026 median: Downtown Brooklyn $1,363 · Brooklyn $1,410
January–August 2026 median: Downtown Brooklyn $215K · Brooklyn $249K
Medians of recorded, index-eligible sales. The headline price is January–August 2026, where at least 50 sales back it; otherwise the last complete year's. The charts show every complete year, and a year with too few sales is left as a gap rather than estimated; the hollow point is 2026 to date (the headline figure, where there is one), not a full year, and * means fewer than 30 sales behind it, so read it as directional. Like the annual medians it includes new-development first sales; the change from the same months of last year uses resales only, and appears only where at least 150 resales back each period. The longer changes run between complete years. The inflation-adjusted view deflates each year's median by the consumer price index to the last complete year's dollars (the current year uses an estimated index). Manhattan is below 96th Street. Each figure carries the mix of what happened to trade, not the like-for-like change of a single apartment. The count beside each change is the sample backing that comparison, which is smaller than the scope’s all-time total. New-development-heavy; thinner resale base. Rents are medians of closed leases that report square footage, for condo and rental buildings; * means few leases. Compiled by The Roebling Team at Compass from public records. Figures are indicative, not an appraisal.
Latest closings in Downtown Brooklyn
The 10 most recent arms-length resales recorded across the buildings profiled here, newest first. Open a building for its full sales record.
| Closed | Building | Unit | Size | Price | $/sf |
|---|---|---|---|---|---|
| Sep 28, 2026 | Concord Village | 10CD | 3 BR | $1,695,000 | — |
| Sep 28, 2026 | 110 Livingston | 3B | 2 BR | $1,414,750 | $1,353 |
| Sep 21, 2026 | Toren | 2504 | 1 BR | $880,000 | $1,192 |
| Sep 10, 2026 | BellTel Lofts | 4K | 2 BR | $890,000 | $971 |
| Sep 3, 2026 | Brooklyn Point | 23E | 2 BR | $2,091,412 | — |
| Sep 3, 2026 | Brooklyn Point | 23E | 2 BR | $2,050,000 | — |
| Sep 2, 2026 | Brooklyn Point | 30K | 1 BR | $1,250,000 | — |
| Sep 2, 2026 | be@Schermerhorn | 12D | 1 BR | $875,000 | $1,250 |
| Aug 28, 2026 | 388 Bridge Street | PH46B | 1 BR | $999,999 | $1,437 |
| Aug 25, 2026 | Concord Village | 9F | 1 BR | $525,000 | — |
Recorded deeds and transfer filings, compiled by The Roebling Team at Compass from public records. $/sf is shown for condominiums with a reported square footage. Sponsor first sales are not listed.
Downtown Brooklyn rents
Downtown Brooklyn rents are up 3.1% in January–September 2026, against the same months of 2025. 2025 was +2.0%, 2024 +2.5%, 2023 +2.4%.
The same apartments, lease to lease, each year against the year before (1,407 lease-to-lease comparisons). 2026 compares January–September with January–September 2025. The latest months can move as late-reported leases arrive.
| Size | 2023 | 2024 | 2025 | 2026 YTD |
|---|---|---|---|---|
| All sizes | $75310 leases+3.1% | $78359 leases+3.6% | $77459 leases−1.5% | $79418 leases+2.4% |
| Studio | $8272 leases | $8392 leases | $83102 leases+0.1% | $86107 leases+4.2% |
| 1 bedroom | $73151 leases+2.8% | $76177 leases+3.5% | $75226 leases−1.4% | $77192 leases+2.6% |
| 2 bedroom | $7284 leases | $7686 leases | $75120 leases−1.4% | $77108 leases+3.0% |
| 3 bedroom+ | — | — | $74*11 leases | $77*11 leases |
Median rent per square foot per year, from closed leases that report square footage. 2026 is January–September. * Fewer than 30 leases.
| Size | 2023 | 2024 | 2025 | 2026 YTD |
|---|---|---|---|---|
| All sizes | $1,167*13 leases | $1,200*11 leases | — | $1,307*10 leases |
Median monthly rent per room, co-op sublets. 2026 is January–September. * Fewer than 30 leases.
Compiled by The Roebling Team at Compass from closed leases, through September 2026. Figures are indicative, not an appraisal. The Roebling Index
How Downtown Brooklyn clears
What closings across Downtown Brooklyn look like at the table, shown against the Brooklyn baseline so each figure reads as a comparison.
- Typical closing vs asking price
- −2.1%
- Share selling above ask
- 12%
- Monthly charges
- $1,530
- Median rooms
- 4.0
At a glance
Where it is: the borough's civic and commercial core, from Cadman Plaza and Borough Hall southeast along the Flatbush Avenue Extension toward Atlantic Terminal — Brooklyn Heights across Court Street, Boerum Hill below Schermerhorn, Fort Greene east of Flatbush Share of recorded sales: condominium 59 percent · cooperative 36 percent · condop 4 percent Market character: 6,979 recorded sales across 125 addresses — the most concentrated market in the Index. Arm's-length runs 65.4 percent, so roughly a third of recorded transfers are something other than an ordinary open-market sale Defining control: the 2004 rezoning and the Special Downtown Brooklyn District. No historic district covers the tower blocks; height here is as-of-right Transit: Jay Street–MetroTech (A, C, F, R), Borough Hall (2, 3, 4, 5), Hoyt–Schermerhorn (A, C, G), Nevins Street (2, 3, 4, 5), DeKalb Avenue (B, Q, R), and Atlantic Terminal with the Long Island Rail Road at the southern edge Watch for: whether the building sells at all. Of the multi-unit residential buildings we track here, more than half are rental — and several of the largest carry a condominium tenure code in city records while a single entity holds the whole property
Why Downtown Brooklyn trades the way it does
One hundred and twenty-five addresses carry 6,979 recorded sales. No other market in the Index concentrates that much trading into that few buildings — the neighborhoods around it spread comparable volume across hundreds or thousands of separate properties. The practical consequence is that a comparable set here is a building exercise, and often a line-and-exposure exercise inside a single tower. Two apartments four blocks apart can sit in different products, different tax positions and different governance regimes, and the neighborhood median will describe neither.
The second consequence is a specific kind of volatility. When a market runs on a small number of very large buildings, one tower closing out its sellout can move a year's reading on its own. That is why the Index publishes Downtown Brooklyn with a caveat for new-development weight, and why the 65.4 percent arm's-length rate matters more here than almost anywhere else we cover: roughly a third of the record is sponsor first-sales, entity-to-entity transfers, related-party deeds and unit-lot corrections.
The third fact should reorganize how a buyer thinks about the neighborhood. Between 2016 and 2025 the cooperative series rose 54.6 percent and beat inflation by 15.2 percent in real terms; over the identical nine years the condominium series rose 24.7 percent and lost 7.1 percent. Same neighborhood, same period, opposite outcomes — because the two are different assets. The cooperative tier is a small, old, resale-only stock that entered the period cheap and was repriced upward as the district densified around it. The condominium tier is largely new construction that entered the record at first-sale pricing set by sponsors at delivery, which is the hardest starting point from which to compound.
The stock
The condominium tier is new, tall and concentrated. The median year of construction across the multi-unit residential buildings we track here is 2014, and fifty of sixty-seven postdate 2005. The most-traded addresses follow from that: 306 Gold Street, 302 apartments over 40 stories, 2005, with 540 recorded sales; 11 Hoyt Street, Studio Gang's 480-unit tower of 2020, with 524; 365 Bridge Street, with 460; and 150 Myrtle Avenue — the Toren Condominium, 239 apartments over 37 stories, 2007 — with 424. The newest and tallest is 9 DeKalb Avenue, 541 apartments across 74 stories, completed in 2021.
The cooperative tier is old, and smaller than its 36 percent share suggests. A handful of prewar and immediately postwar addresses dominate it, the largest by a wide margin being Concord Village at 175 Adams Street — 1,022 apartments in a 1950 complex — with 165 Sands Street, a 120-unit building of 1902, among the others. These are room-count buildings with board terms, in a neighborhood that otherwise prices per square foot. The four percent condop share is a third form again — shares in a cooperative that owns one condominium unit in a building whose commercial space is separate. What you receive is still stock and a proprietary lease, so read the lease rather than assuming condominium flexibility.
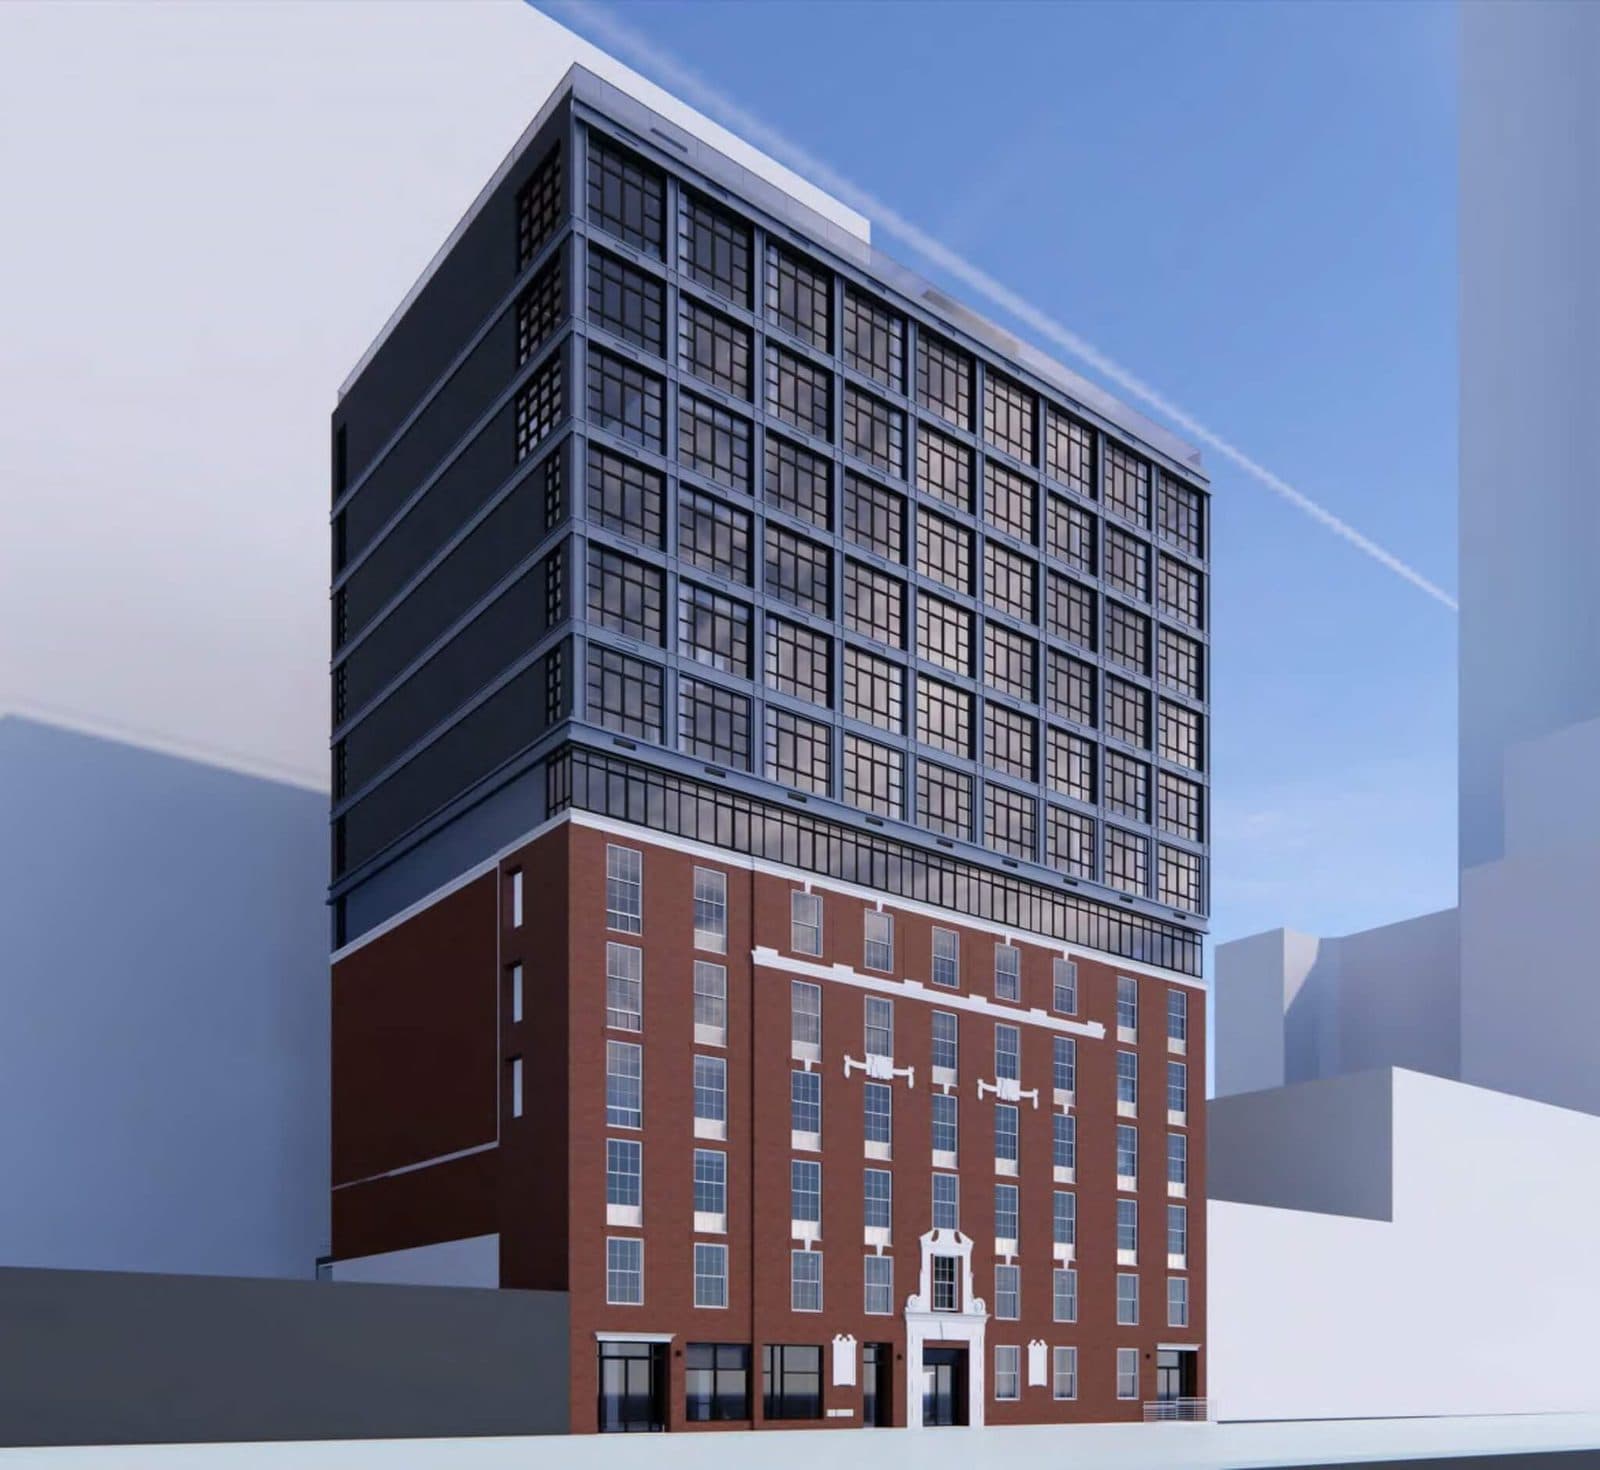
One building sits between the tiers and is worth studying for what it discloses. 110 Livingston Street is a 1926 McKim, Mead & White clubhouse — for six decades the address of the Board of Education — converted to a 299-unit condominium in 2007, with 478 recorded sales. Its offering plan carries a transfer fee of 10 percent of gross sale price if a unit is offered or contracted for resale before the second anniversary of its closing, dropping to 1 percent thereafter.
The 2004 rezoning, and what it actually produced
Downtown Brooklyn was rezoned in 2004 to grow a commercial back-office district. What came out of the ground was overwhelmingly residential, and it came fast: three-quarters of the buildings we track here postdate the action. Control runs through the Special Downtown Brooklyn District and the underlying commercial districts rather than through any preservation instrument. The offering plan at 11 Hoyt records its site as C5-4 within the Special District and notes that the Boerum Hill Historic District and its 2018 extension both sit south of Atlantic Avenue and Pacific Street, well clear of the tower blocks. There is no Landmarks review over this skyline.
Two things follow. First, the skyline is unfinished and no mechanism would stop the next building; a view line here is a lease on air rights someone else owns, and should be priced as an amenity that can be taken away. Second, tax treatment is building-specific and must never be assumed from vintage. New construction here does not automatically carry an exemption: the sponsor's tax counsel at 11 Hoyt stated in writing that the residential condominium would not apply for any exemption or abatement, and a 25-year commercial abatement was filed for the retail component only. Elsewhere in the cohort benefits do exist, at different terms and different points in their schedules. This guide asserts no phase-out year for any building. Pull the current Department of Finance tax bill for the unit, establish how many benefit years have run, and underwrite the unabated carrying cost.
Sponsor closings and resales are not the same evidence
A tower's sale history opens with a sellout. Several hundred first closings arrive inside a compressed window at prices set by one seller working from one schedule, and they enter the public record indistinguishable in form from a resale two years later. At 306 Gold Street, 540 recorded sales against 302 apartments means fewer than two recorded transfers per apartment since the building opened — and the first cohort of those was a sellout rather than a market. Strip the first-sale tranche out before you compute anything.
Sponsors also do not always leave. At 110 Livingston Street the sponsor still owned 62 residential units as of December 31, 2024 — roughly 22 percent of the common interest — operated as rentals. That is a governance fact, a financing fact and a supply fact at once: it shapes board control, it bears on lender owner-occupancy thresholds, and it means part of the building competes with your resale as rental inventory. Ask in writing what share the sponsor still holds and what share of the building is owner-occupied. Institutional lenders set thresholds on the second number, and a building that fails one can be hard to finance whatever the apartment is worth.
The last version of the problem is the building that never sold at all. More than half the multi-unit residential buildings we track here are rental, and several of the largest towers carry a condominium tenure code in city records while a single limited liability company appears as owner of the entire property — the signature of a rental held in condominium form, with a recorded declaration, a handful of deeded units and hundreds of apartments that were never individually conveyable.
Daily life and getting around
Fulton Street is the retail spine, pedestrianized through its central stretch, with City Point at Flatbush Avenue Extension and DeKalb as its anchor and food hall. Cadman Plaza Park is the green room on the Brooklyn Heights side, and Borough Hall the civic center around which the Court Street offices and courts cluster. NYU Tandon, Brooklyn Law School and New York City College of Technology sit inside the district; the Brooklyn Academy of Music and the Cultural District begin immediately east across Flatbush in Fort Greene.
Transit is the structural advantage and the reason the towers are where they are. Jay Street–MetroTech carries the A, C, F and R; Borough Hall the 2, 3, 4 and 5; Hoyt–Schermerhorn the A, C and G; Nevins Street the 2, 3, 4 and 5; DeKalb Avenue the B, Q and R. Atlantic Terminal, at the southern edge, adds the Long Island Rail Road. No other Brooklyn market puts this many routes inside a ten-minute walk, and within the neighborhood the distance to a station differentiates less than it does anywhere else — pushing the value variables back onto floor, exposure and the tax line.
What to know if you're buying here
Confirm the building actually sells before anything else. Get the declaration of condominium and its unit count, confirm your unit appears among those offered in the plan's Schedule A, and check ACRIS for individual unit deeds on the line you want.
Filter the sale history before you read it. At 65.4 percent arm's-length, roughly a third of the record is not open-market evidence. Separate sponsor first-sales from resales, discard entity-to-entity transfers, and build your comparable set from resales in the same building — ideally the same line.
Underwrite the tax line rather than the abatement label. A benefit's existence, its term and its position in the phase-out schedule are three different questions, and only the current Department of Finance bill answers them. At least one major building here carries no residential exemption at all. Model the fully unabated monthly number.
Read the transfer-fee schedule before you assume a short hold works. A 10 percent seller-paid fee on any resale inside two years, as at 110 Livingston Street, changes the arithmetic of a purchase entirely. Fees of this kind are building-specific, appear in the offering plan and the condominium's financials, and are almost never mentioned in marketing.
Decide which tenure you are buying, and shop within it. The two series moved in opposite real directions over the same nine years. Co-ops price per room and carry board terms, financing ceilings and sublet policy; condominiums price per square foot and carry a tax line that moves.
What to know if you're selling here
Your competition is in your own building, probably on your own line. With 125 addresses carrying the whole market, buyers compare directly and narrowly. Position against resales in your tower with your exposure and your square footage rather than against a neighborhood figure that blends a 1950 cooperative with a 74-story condominium.
If sponsor inventory or rental units remain in the building, address it up front. A buyer's counsel will find the sponsor's holding and the owner-occupancy percentage in diligence, and finding it late costs more than disclosing it early. Where the number is good it is a selling point; where it is not, resolve the lender question before going to market.
Lead with the carrying cost, and lead with it honestly. In a market this new, the monthly number — common charges plus the current tax line, with the unabated figure alongside it where a benefit applies — is where deals are won and lost. A clean, documented monthly presentation moves a listing faster than a lower ask does.
Where it sits in the Index
Downtown Brooklyn is the Index's concentration case: the most trading in the fewest buildings, one of the lowest arm's-length rates we publish, and the clearest example of why tenure has to be read separately from geography. The cooperative series beat inflation by 15.2 percent while the condominium series fell 7.1 percent in real terms over the same 2016-to-2025 span — what happens when an old, small resale stock and a large new-construction sellout stock share a name. Read it against Brooklyn Heights immediately west, where a 1965 historic district and a cooperative-weighted stock produce the opposite structure, and against Boerum Hill to the south. The full parent-market read is on The Roebling Index.
Run the numbers
Related guides
- Brooklyn Heights — A Buyer's Guide — the cooperative market across Court Street, and the closest structural contrast
- Boerum Hill — A Buyer's Guide — the row-house neighborhood south of Schermerhorn, where the seam towers sit
- Fort Greene — A Buyer's Guide — east across Flatbush, with the Cultural District
- NYC Real Estate Tax & Closing Cost Guide
Buildings in Downtown Brooklyn
Get the neighborhood read on your building.
See how your apartment compares with the rest of Downtown Brooklyn, or get a market update tuned to this neighborhood — sent to you directly.