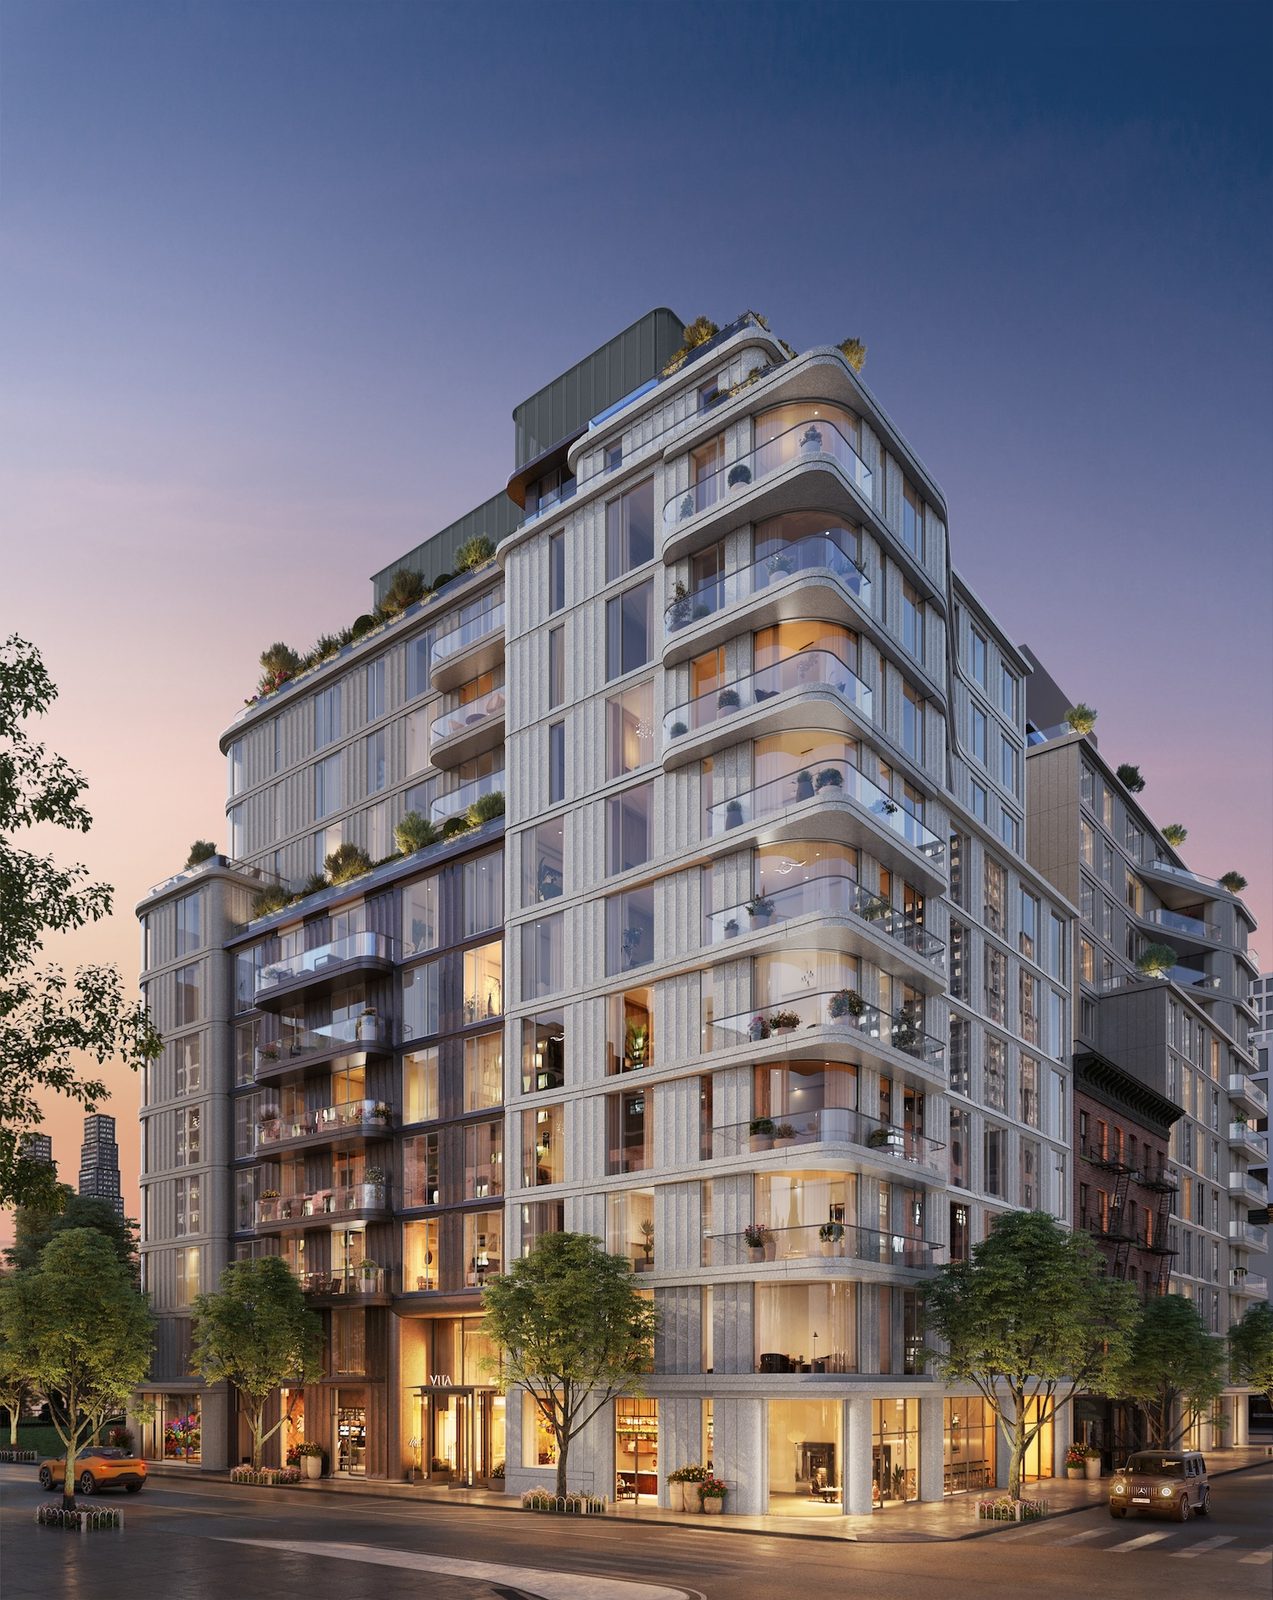
400 West 38th Street (VITA)Recorded sales & closing prices
400 West 38th Street, New York, NY 10018
20 recorded closings, 2026. Sortable and searchable below.
- Recorded closings
- 20
- Date range
- 2026
- Median $/sf
- $2,145
- Monthly carry/sf
- $2.62
- Price range
- $1.2M – $2.95M
Change in the building’s median $/sf over each window, from the raw yearly medians — too few standardized single-line units here to adjust to an average-floor basis, so which apartments happened to trade moves these alongside price. (2022 marks the rate-shock inflection.) Like-for-like repeat-sale figures to follow.
VITA launched sales in May 2025 with pricing starting at approximately $1.25 million, and the first closings were recorded in March 2026. The building is an active sponsor sellout; the transaction record is a sponsor price record, not a resale market.
That has two consequences for pricing. First, published sponsor pricing in a live sellout is a negotiated number more often than it looks, and the leverage varies by line and by how much inventory remains in a given stack. Second, there is no resale comparable set here yet, so a buyer's real reference points are the corridor's 2006–2010 condominium inventory adjusted upward for construction quality, energy performance and amenity, and the Hudson Yards new-development tier adjusted downward for location and finish level. VITA sits between those two sets rather than inside either.
Sellers will not have a meaningful resale market in this building for another cycle. Anyone buying with a short hold in mind should underwrite that directly. Unit-level transaction history is maintained in The Roebling Research Library and shared with clients during diligence.
The complete recorded-sale history for VITA; the 400 West 38th Street building is marketed as VITA North Tower and the 401 West 37th Street building as its south counterpart, compiled from NYC Department of Finance transfer records, with apartment-by-apartment detail from The Roebling Research Library.
Price per square foot over time
5 sales with a known square footage, by closing date.
Recent closings
The building’s 10 most recent market sales.
| Date | Unit | Apartment | Price | $/sf | vs. Ask |
|---|---|---|---|---|---|
| Aug 20, 2026 | 5EN | 1 BR · 1 BA · 606 sf | $1,300,000 | $2,145 | -0.4% |
| May 21, 2026 | 4GN | 2 BR · 2 BA · 987 sf | $2,175,000 | $2,204 | +0.0% |
| May 20, 2026 | 7BN | $1,330,000 | — | ||
| Apr 30, 2026 | 2BN | 1 BR · 1 BA · 617 sf | $1,200,000 | $1,945 | +0.0% |
| Apr 28, 2026 | 3AN | $1,295,000 | — | ||
| Apr 16, 2026 | 8GN | $2,275,000 | — | ||
| Apr 2, 2026 | 10CN | 2 BR · 2 BA · 1,249 sf | $2,950,000 | $2,362 | — |
| Mar 30, 2026 | 4AN | $1,330,000 | — | ||
| Mar 30, 2026 | 11CN | $2,970,000 | — | ||
| Mar 24, 2026 | 4BN | $1,285,000 | — |
Every recorded sale
Sort any column; filter by unit or keyword. Prices are the recorded transfer amount at the NYC Department of Finance. Every sale sits in one of three states: counted in the building’s medians and trend; shown but excluded as a non-arms-length or nominal transfer; or shown and ⚑ flagged for review — a possible duplicate filing or an extreme $/sf outlier, held out of the statistics pending manual verification rather than allowed to move them.
| Apartment | ||||||
|---|---|---|---|---|---|---|
| Aug 20, 2026 | 5ENSponsor Sale | 1 BR · 1 BA | 606 | $1,300,000 | $2,145 | -0.4% |
| May 21, 2026 | 4GNSponsor Sale | 2 BR · 2 BA | 987 | $2,175,000 | $2,204 | +0.0% |
| May 20, 2026 | 7BN | — | $1,330,000 | — | — | |
| Apr 30, 2026 | 2BNSponsor Sale | 1 BR · 1 BA | 617 | $1,200,000 | $1,945 | +0.0% |
| Apr 28, 2026 | 3AN | — | $1,295,000 | — | — | |
| Apr 16, 2026 | 8GN | — | $2,275,000 | — | — | |
| Apr 2, 2026 | 10CNSponsor Sale | 2 BR · 2 BA | 1,249 | $2,950,000 | $2,362 | — |
| Mar 30, 2026 | 4AN | — | $1,330,000 | — | — | |
| Mar 30, 2026 | 11CN | — | $2,970,000 | — | — | |
| Mar 24, 2026 | 4BN | — | $1,285,000 | — | — | |
| Mar 24, 2026 | 6GN | — | $2,255,547 | — | — | |
| Mar 24, 2026 | 7GN | 2 BR · 2 BA | 1,065 | $2,250,000 | $2,113 | — |
| Mar 19, 2026 | 5GN | — | $2,250,912 | — | — | |
| Mar 11, 2026 | 5BN | — | $1,300,000 | — | — | |
| Mar 10, 2026 | 6AN | — | $1,340,000 | — | — | |
| Mar 5, 2026 | 9BN | — | $2,380,000 | — | — | |
| Mar 4, 2026 | 7EN | — | $1,335,000 | — | — | |
| Mar 4, 2026 | 4CN | — | $1,285,000 | — | — | |
| Mar 4, 2026 | 5AN | — | $1,325,000 | — | — | |
| Mar 3, 2026 | 2CN | — | $1,150,000 | — | — |
Sources, exclusions and how these figures are computed
Sales sourced from NYC Department of Finance recorded transfers (BBL 1-00735-7502). Apartment-level facts (line, condition, asking-price context) curated and cross-verified in The Roebling Research Library. Not all transactions cross-verify with ACRIS records — sponsor and LLC purchases sometimes record at stipulated values rather than market price; square footage from recorded condo declarations and offering plans. Storage, parking, and commercial units are excluded from all figures. Floor- and line-level $/sf are time-controlled (each sale measured against the building’s going rate at the time of sale) and expressed at today’s pricing, so they isolate the floor or line premium rather than blend two decades of market movement.
Put this data to work.
Know what’s fair before you offer — we’ll show you where each line trades, the building’s discount-to-ask pattern, and where the value sits right now.
Price to the building’s real trajectory, not a guess — we’ll position your line against its true comps to maximize the outcome.