How One Tower Shaped Central Park's Quarter
The Roebling Report · By Corey Cohen · Principal, The Roebling Team at Compass
Seven closings at 50 West 66th Street generated one-fifth of the quarter's dollar volume — but the established market beneath them traded on very different terms.
The Central Park market produced 137 recorded apartment sales totaling $672 million in the second quarter. Thirty-eight closed at $5 million or more.
Extell's 50 West 66th Street recorded seven sponsor closings totaling $137 million. Four of them — totaling $113 million — ranked among the quarter's ten largest and represented 42 percent of the top ten's combined value.
| Q2 2026 | Entire market | 50 W. 66th |
|---|---|---|
| Closings | 137 | 7 |
| Dollar volume | $672M | $137M |
| $10M+ closings | 14 | 4 |
| Share of dollar volume | 100% | 20% |
On published interior dimensions, the seven sales averaged $5,503 per square foot. The four upper-floor transactions traded from approximately $6,056 to $7,440 per square foot; the three lower-floor sales ranged from approximately $2,431 to $2,808.
The spread shows how sharply elevation, outlook and position were priced within the same building.
Last year's volume came from somewhere else
Recorded activity declined from the same quarter last year: 137 closings against 195, and $672 million in dollar volume against $953 million.
The concentration also moved. Billionaires' Row recorded $344 million in Q2 2025, compared with $73 million this quarter; 50 West 66th contributed $137 million this year.
How the four corridors traded
Scope of the figures below: every recorded apartment closing in the second quarter of 2026 across four corridors — Central Park West, Fifth Avenue, Central Park South and Billionaires' Row — at any price, with the share at $5 million and up shown separately. This is a different cut from the standing Central Park report, which runs continuously, carries a $4 million floor, and includes Park Avenue as a fifth corridor. The two are not meant to reconcile; compare a figure here against the same corridor, period and threshold there before drawing a conclusion.
| Corridor | Q2 2026 closings | Q2 2026 volume | $5M+ | Q2 2025 closings | Q2 2025 volume |
|---|---|---|---|---|---|
| Central Park West | 71 | $399M | 32% | 98 | $407M |
| Fifth Avenue | 40 | $179M | 28% | 43 | $171M |
| Central Park South | 13 | $21M | 8% | 23 | $31M |
| Billionaires' Row | 13 | $73M | 23% | 31 | $344M |
Fifth Avenue changed very little from last year because its established co-op market traded without a major new development influencing the result.
Central Park West's total tells a different story. 50 West 66th — half a block off the park, and grouped with the corridor because that is the market it competes in — generated more than one-third of the corridor's dollar volume, sitting above an established resale market with a $2.37 million median.
The southern corridors were thinner and more dependent on individual transactions. Hampshire House's $8 million sale was Central Park South's only closing above $5 million. On Billionaires' Row, the steep decline from last year largely reflects the timing of sponsor closings rather than a comparable drop across every building.
Two sources of trophy value
The quarter's most useful comparison was between 50 West 66th and the Dakota.
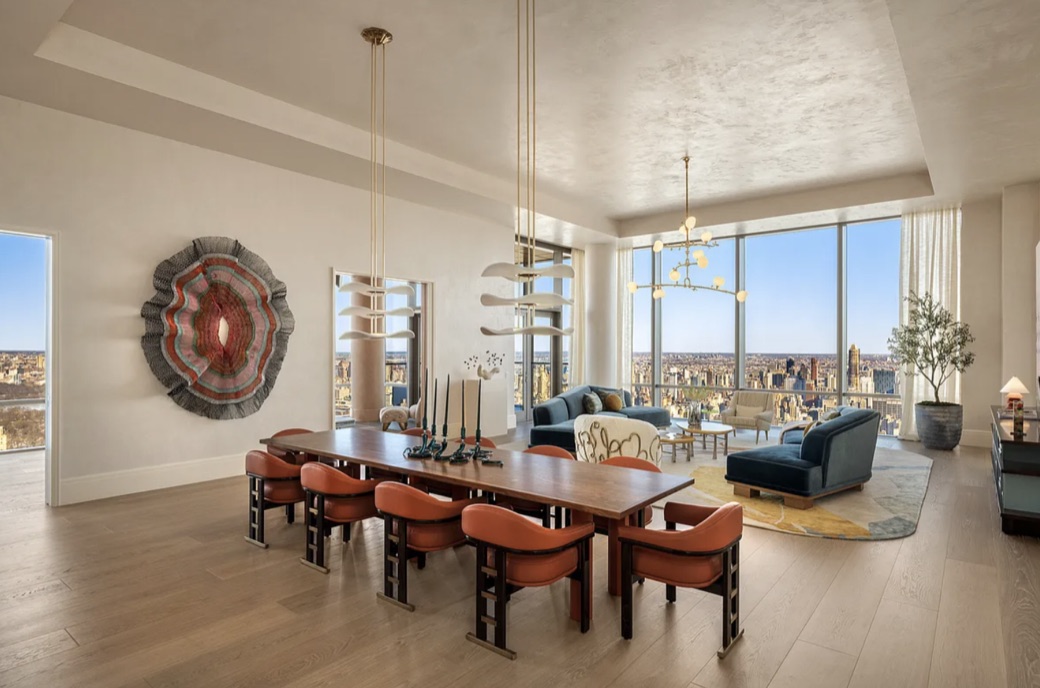
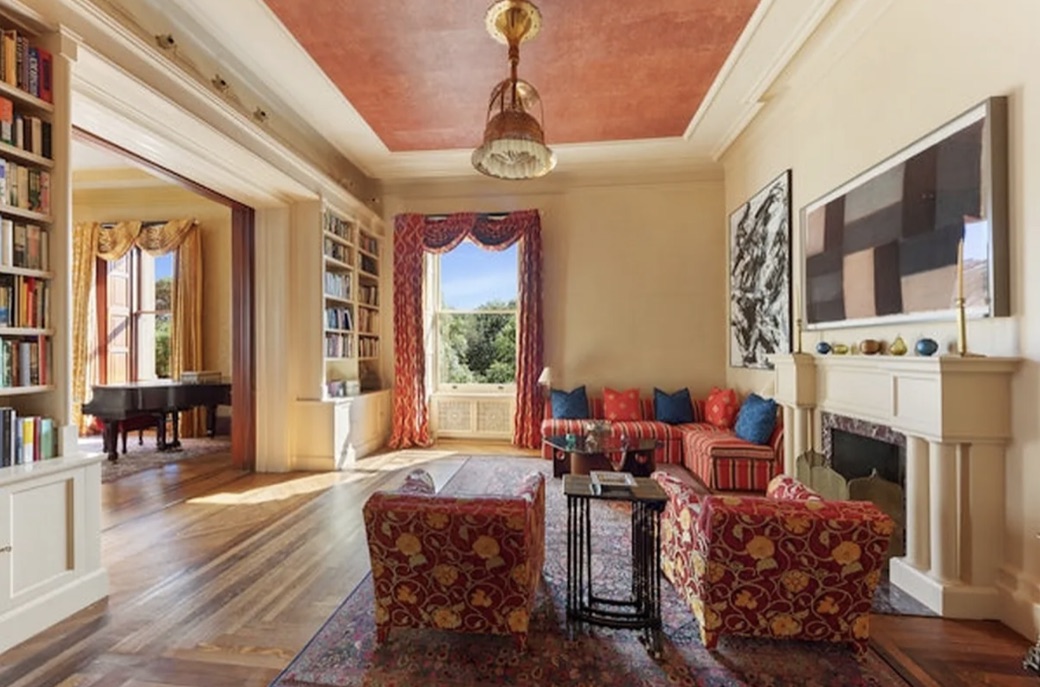
Apartment 33 at the Dakota closed for $22.5 million. Based on its published 5,019 square feet, that was approximately $4,483 per square foot — within the total-price range of the new tower's sponsor inventory, though below its upper-floor sales on a square-foot basis.
The two properties reached trophy prices for different reasons. At 50 West 66th, buyers paid for new construction, elevation, views and amenities. At the Dakota, the premium came from architecture, provenance, direct Central Park frontage and the scarcity of a building that rarely turns over.
Three resales, three different outcomes
Three of the quarter's ten largest resales had clearly documented prior sales.
| Apartment | Prior sale | Q2 2026 sale | Nominal change |
|---|---|---|---|
| 15 Central Park West #27D | $8.879M · 2007 | $21.950M | +147% |
| 15 Central Park West #8B | $21.500M · 2017 | $21.000M | −2% |
| 1 Central Park West #48A | $21.850M · 2013 | $15.125M | −31% |
The results run in three directions. Apartment 27D at 15 Central Park West more than doubled from its original sponsor price. Apartment 8B traded slightly below its 2017 purchase price. At 1 Central Park West, apartment 48A sold for roughly $6.7 million less than it did in 2013.
These are individual apartments, not an index. But they show why the building name alone never tells the whole story. Entry price, apartment position, condition and the competitive set at the time of resale all affect the outcome.
Changes are nominal and do not account for renovations, inflation, carrying costs or transaction expenses.
What this means for owners
For owners in existing Central Park West buildings, 50 West 66th raises the corridor's visible ceiling without automatically resetting comparable values. Apartments with exceptional views, scale, condition and elevation have the strongest claim to participate in that benchmark.
For Fifth Avenue co-op owners, the $33.5 million closing at 875 Fifth Avenue is a more relevant market signal than a sponsor sale in a new condominium. The ownership structure, corridor and approval process are comparable even when the apartments themselves are not.
Below $5 million, the trophy activity is largely a separate market. Nearly three-quarters of the quarter's transactions closed below that level, priced according to their own building, layout, condition and corridor.
The next tower
50 West 66th will not be the last new development to alter the Central Park record.
Naftali's planned Robert A.M. Stern condominium at 800 Fifth Avenue will introduce something the corridor almost never receives: new ownership product directly on the park.
As detailed in When Prestige Depreciates, project consultants underwrote the finished units at roughly $11,000 per square foot. Whether that becomes a Fifth Avenue benchmark — or simply expands the premium between new condominiums and established co-ops — will be one of the defining questions of the next development cycle.
When those sales eventually record, they can lift Fifth Avenue's headline figures before the established market around them necessarily moves.
The record: Q2's ten largest closings
| Date | Price | Building | Unit | Type |
|---|---|---|---|---|
| Jun. 1 | $41,750,076 | 111 West 57th Street | PH76 | Sponsor |
| May 21 | $36,291,912 | 50 West 66th Street | 56N | Sponsor |
| May 12 | $35,730,500 | 50 West 66th Street | 53N | Sponsor |
| Jun. 15 | $33,500,000 | 875 Fifth Avenue | PH A/B | Resale |
| May 26 | $23,991,875 | 50 West 66th Street | 40N | Sponsor |
| May 19 | $22,500,000 | The Dakota, 1 West 72nd Street | 33 | Resale |
| Apr. 13 | $21,950,000 | 15 Central Park West | 27D | Resale |
| Jun. 2 | $21,000,000 | 15 Central Park West | 8B | Resale |
| Jun. 5 | $17,052,816 | 50 West 66th Street | 40W | Sponsor |
| Apr. 17 | $15,125,000 | 1 Central Park West | 48A | Resale |
No single quarter is the market, and no single tower is either. If you own near Central Park — or are deciding whether to — the useful question is which part of this market your apartment actually competes in.
Book a consultation with Corey →
Best,
Corey Cohen Principal, The Roebling Team at Compass c.cohen@compass.com · 646.939.7375
Methodology:The Central Park universe includes residential buildings directly on Central Park West, Fifth Avenue from Grand Army Plaza through 110th Street, and Central Park South, plus qualifying 57th Street and adjacent side-street towers with material Central Park exposure. Each transaction is assigned to one corridor to prevent double counting. All qualifying residential units in those buildings are included; individual apartments need not have direct park views. Non-arm's-length transfers and commercial assets are excluded. Transactions are verified against the public record. Price-per-square-foot calculations use published interior dimensions, and dollar volumes are rounded. Co-op square footage should be treated as approximate. The complete record of 137 qualifying transactions is available on request.