Theater District
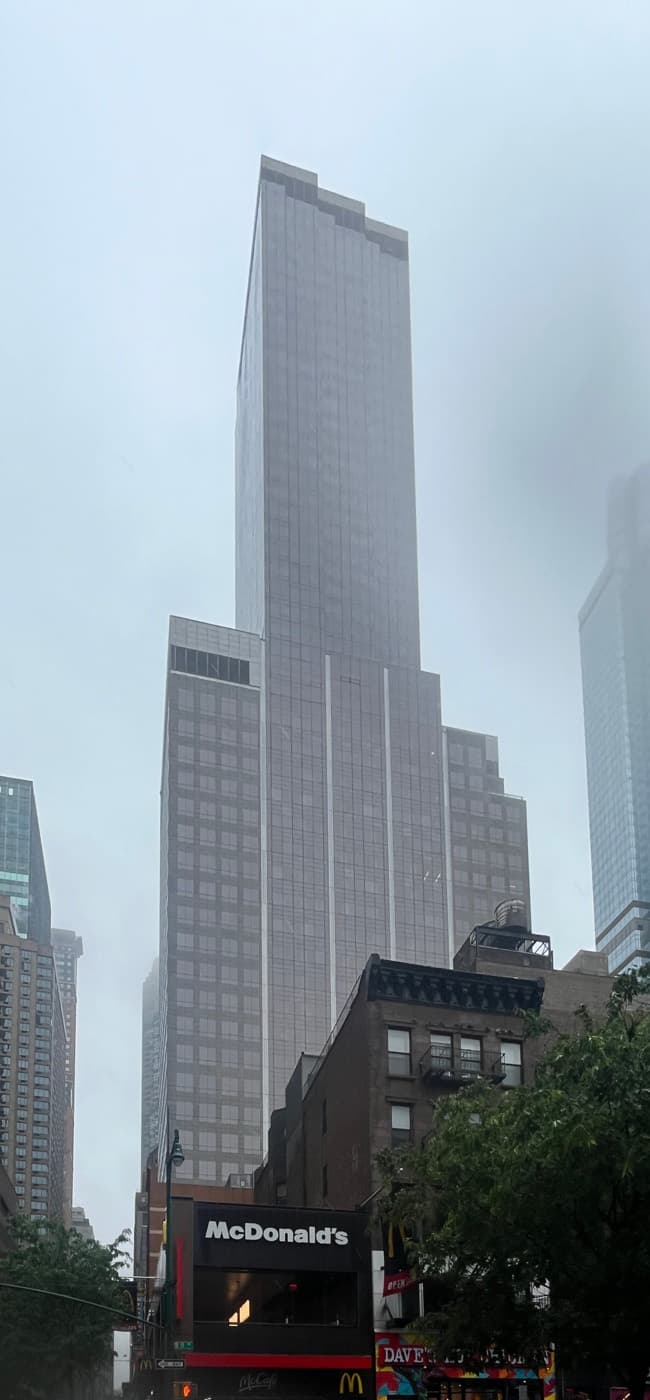
The Theater District's residential inventory sits above and behind Broadway's houses — postwar towers, a handful of pre-war buildings, and condominium construction on the Eighth Avenue side. It is the noisiest and most transient part of Midtown, and the buyer pool reflects that: weighted toward pied-à-terre and investor ownership, light on families. That mix shows up at the closing table — sellers concede more than the Manhattan norm and very few sales clear above ask. Buy on the specific line and exposure; variance within a single building is wide.
What the index shows for Theater District
Median condominium price per square foot and cooperative price per room, with the change over the past year and since 2022 and 2016. Condos are measured by the foot, co-ops by the room.
Medians of recorded, index-eligible sales, measured to the last complete year — each figure carries the mix of what happened to trade, not the like-for-like change of a single apartment. The count beside each change is the sample backing that comparison, which is smaller than the scope’s all-time total. New-development-heavy; thinner resale base. Compiled by The Roebling Team at Compass from public records. Figures are indicative, not an appraisal.
How Theater District clears
What closings across Theater District look like at the table, shown against the Manhattan baseline so each figure reads as a comparison.
- Typical closing vs asking price
- −5.1%
- Share selling above ask
- 7%
- Monthly charges
- $2,670
- Median rooms
- 4.0
At a glance
Where it is: Midtown between Sixth and Eighth Avenues, from the low 40s through the West 50s — the Broadway theater blocks and Times Square, with the residential inventory set behind and above them and thickening toward 56th and 57th Streets Share of recorded sales: condominium 71 percent · cooperative 17 percent · commercial 12 percent — one of the largest commercial shares on the Manhattan map Market character: 50.9 percent arm's-length across 4,163 recorded sales at only 71 addresses, with sponsor-flagged activity at 8.6 percent — roughly half the record is not a household-to-household trade, and developer first-sales explain only a small part of the gap Defining control: the Theater Subdistrict of the Special Midtown District — a special zoning district since 1967, folded into the Special Midtown District adopted May 13, 1982, and since 1998 the mechanism by which 43 listed theaters sell unused development rights to receiving sites nearby Transit: the Times Square–42nd Street complex (1, 2, 3, 7, N, Q, R, W and the shuttle); A, C and E at 42nd Street–Port Authority; B, D, F and M at 47–50th Streets–Rockefeller Center; N, Q, R and W at 57th–Seventh Watch for: trade count is not comparable depth — several of the deepest address records here are hotel and vacation-ownership conveyances, not apartment resales Published with a caveat: the Index flags this series new-development-heavy, with a thinner resale base than its transaction count implies — the correct starting posture for everything below
Daily life and getting around
The theaters are the smallest buildings on their blocks. Most of the Broadway houses are mid-block structures of three or four stories put up between the 1900s and the 1920s, and from any distance you do not see them at all — you see the towers and signage built around and above them, which is the arrangement the zoning was written to produce. Broadway between 42nd and 47th Streets is a pedestrian plaza, closed to vehicles as a trial from Memorial Day 2009, made permanent on February 11, 2010, and rebuilt in stages finished just before New Year's Eve 2016; roughly 330,000 people move through Times Square on an average day and closer to 460,000 at peak. North of 50th Street the crowd thins block by block, and by 55th and 56th the district behaves like ordinary Midtown, residential entrances no longer competing with ticket queues.
The rhythm is set by curtain times rather than commuting: sidewalks fill twice on a matinee day and empty hard between, and the hour after an evening curtain is the loudest ordinary event on the calendar. This is a working entertainment district with apartments in it, and the noise, tour buses, loading-door deliveries and standing police presence around the plazas are permanent conditions, not nuisances that resolve.
Everyday retail runs on Eighth Avenue and the cross streets between Eighth and Broadway — groceries, pharmacies, hardware, the ordinary apparatus Times Square itself does not supply. Green space is the weakest amenity: effectively none inside the district, with Bryant Park off the southeast corner and Central Park a walk from the 57th Street end. Transit is the strongest argument the neighborhood makes, and it is not close — from most addresses here three separate trunk lines are inside five minutes.
Why the Theater District trades the way it does
The organizing number is 50.9 percent — the arm's-length share of the recorded sale history — and what matters is the figure beside it. Sponsor-flagged activity is only 8.6 percent. In the sponsor-heavy Manhattan markets, developer first-sales account for most of the distance between the arm's-length share and 100 percent; here they account for less than a fifth of it. The rest is something else: transfers inside hotel and vacation-ownership structures, commercial conveyances, and related-party movement in a district where 12 percent of recorded sales are commercial outright.
The deepest address records show what that means. 870 Seventh Avenue is the Park Central Hotel, opened June 12, 1927; half of its 1,450 rooms were converted in 1995 into The Manhattan Club, a 266-unit all-suite timeshare addressed 200 West 56th Street. 1335 Sixth Avenue is the New York Hilton Midtown, opened in 1963, which houses vacation-ownership club inventory. Deeded interval and club conveyances record like any other transfer. A buyer who reads a four-figure trade count as four figures' worth of apartment comparables has misread the instrument, not the market.
This is also why the Index publishes the neighborhood with a caveat — new-development-heavy, thinner resale base — and the flag should be read literally, not as boilerplate. Out of 4,163 recorded sales, the 2025 index sample produced 54 condominium and 11 cooperative observations. Both series ended the last complete year below their 2016 level in nominal terms and materially below it in real terms, an unusual reading on the Manhattan map; but the cooperative line rests on a sample small enough to be treated as a direction, not a level.
The stock
The condominium tier is 71 percent of the record and the working market — overwhelmingly post-2000 construction on assembled sites, tall and priced per square foot. 1600 Broadway is the type specimen at the southern end, a 25-story, 136-unit condominium by Einhorn Yaffee Prescott on the site of the 1902 Studebaker Building, demolished in 2004; 247 West 46th Street, the Platinum, sits mid-block between Broadway and Eighth on the same logic. At 423 and 499 recorded sales they are the closest thing here to a readable resale record.
The cooperative tier is 17 percent and sits mostly north of 53rd Street, where the building library thickens — 230 West 56th Street, 150 West 55th Street, 146 West 57th Street. This is older, smaller, board-governed stock that behaves far more like Central Midtown than like Times Square, and it is where a primary-residence buyer usually lands.
The single most consequential building-level fact in the neighborhood sits in that tier. 100 West 57th Street, Carnegie House, is a 324-apartment cooperative completed in 1962 that does not own the land beneath it. The land traded in 2014 for $285 million against ground rent then running at roughly $4.4 million a year, with a reset provision in the lease. A ground-lease cooperative prices on the lease: reset mechanism, reset date, remaining term and the corporation's reserves govern value more than square footage does. Read the lease and the audited financials, not a summary of them.
Price the condominium tier per square foot and the cooperative tier per room with the board terms attached — and establish the land position before either.
The Theater Subdistrict, and what the theaters do to the land
The controlling regime is zoning layered on landmarking, and both were built to solve the same problem. A Special Theater District was mapped in 1967 to stop legitimate theaters being replaced by office towers; it was folded into the Special Midtown District adopted May 13, 1982 as the Theater Subdistrict, divided into a Core covering Times Square and an Eighth Avenue corridor, the latter overlapping the Special Clinton District on the west side of Eighth between 42nd and 45th Streets. Landmarking arrived next, in volume: between November 1987 and January 1988 the Landmarks Preservation Commission designated 28 Broadway theaters — the interior and exterior of nineteen, the interiors alone of seven, the exteriors alone of two — and the Board of Estimate ratified the batch in March 1988. The Shubert Organization, the Nederlander Organization and Jujamcyn sued in June 1988 over 22 of them, arguing the designations were pretextual industry protection rather than individual landmark findings. The designations were upheld, and the United States Supreme Court denied review in 1992.
Together the two produced the mechanism a buyer actually meets. Because a designated three-story theater cannot be redeveloped, the 1998 zoning text amendment let 43 listed theaters sell unused development rights to receiving sites within the subdistrict, against a per-square-foot contribution to the Theater Subdistrict Fund — $10 at adoption, $14.91 in 2006, $17.60 in 2011, restructured to a share of sale price by City Planning Commission approval on November 16, 2016. By City Planning's March 2016 accounting, 23 actions had moved roughly 600,000 square feet from 9 granting theaters to 15 receiving sites.
That machinery leaves recorded paper at both ends. Section 81-743 of the Zoning Resolution requires a declaration of restrictions recorded with the Register before a permit issues, binding owners and successors to continued legitimate theater use for the life of the receiving development, a five-year operator commitment, certification of physical soundness, a landmark maintenance program where applicable, and inspection every five years; Section 81-747 adds declarations and performance bonds where rights cross intervening lots. The consequence is routinely missed — a tall residential building here may stand at its height only because it bought theater air rights, and the instruments that permitted it are recorded against the property in ACRIS.
The signs are not optional
Under Section 81-732, developments on zoning lots between 43rd and 50th Streets with frontage on Seventh Avenue or Broadway must carry illuminated signage — a minimum aggregate surface area per linear foot of frontage, specified minimum illumination levels, and a requirement that the signs stay lit from dusk until 1:00 a.m. daily. The rule attaches to the development, not the use, so a residential building on a covered frontage carries the obligation exactly as a retail one does.
The signage that makes the district recognizable is, on those frontages, a legal condition of building here, and it comes attached to the apartment — a revenue line for the condominium below, a permanent lighting condition for the units above. Before buying on a covered frontage, establish what signage the building carries, what it earns, what the board may and may not change, and how the light behaves on your line at eleven at night.
What to know if you're buying here
Filter the record harder than you would anywhere else. At 50.9 percent arm's-length with only 8.6 percent sponsor-flagged, the usual instruction — strip out the developer closings — is not enough. Pull the address's own history, identify what instrument each transfer actually is, and build the comparable set from ordinary resales only. In several buildings that leaves a very short list, and the short list is the honest answer.
Buy the line and the exposure, not the building. Variance within a single building is wider here than almost anywhere in Manhattan, because what varies — sign light, marquee noise, mechanical plant, the sightline into a plaza or a loading door — changes floor to floor and side to side. See the apartment at night, on a performance night.
Establish the land position first. The tenure column does not tell you whether the corporation owns its land. Ask directly, and where the answer is no, read the reset mechanism, reset date and remaining term before you look at a price per room.
Have your attorney read the title chain for recorded declarations. Theater development-rights transfers and the landmark transfers under Section 81-747 leave declarations and notices of restriction recorded against receiving sites. They are public, they run with the land, and they occasionally carry obligations a residential owner should know about — a short question, and a serious problem if nobody asks it.
Underwrite the non-residential percentage. Where hotel, retail and signage floor area sits inside the same declaration as the apartments, the share of a building that is not residential is a financing question before it is anything else. Conforming lenders apply a threshold; ask for the number and which lenders have closed loans there in the past year.
What to know if you're selling here
Your buyer pool is narrower than your building's trade count suggests. Ownership here is weighted toward pied-à-terre and investor buyers and light on families, and the depth in the recorded history is partly instrument rather than demand. Price to the pool that exists for your line and exposure, and plan a longer marketing period rather than reading time on market as a pricing failure.
Bring the light, noise and carrying-cost answers forward. Signage obligations, ground-lease status where it applies, assessments, the non-residential percentage and recent lender activity are what re-trade deals here. A seller with the lease, the financials and the declaration to hand on day one removes the most common cause of a week-six renegotiation.
Do not price against 2016. As of the last complete year both tenure series stood below their 2016 nominal level and well below it in real terms. A seller anchored to a purchase price from the middle of the last decade is anchored to a level the recorded market has not supported, and an overpriced listing here sets the comparable that prices the next apartment down.
Where it sits in the Index
The Theater District publishes with a caveat — new-development-heavy, thinner resale base — on 2,325 index-eligible observations drawn from 4,163 recorded sales at 71 addresses, running from 2003. Treat both lines as directional rather than definitive, the cooperative series especially, and comp the neighborhood against Central Midtown and Midtown South, which share its structure, rather than the resale-deep uptown markets. See the Roebling Index for the current read.
Run the numbers
Related guides
- Central Midtown — A Buyer's Guide — the blocks immediately east, and the closest structural comparison
- Midtown South — A Buyer's Guide — the same new-development profile on a thinner record
- Manhattan Apartment Buying Guide — Pillar 2
- NYC Real Estate Tax & Closing Cost Guide
Buildings in Theater District
Get the neighborhood read on your building.
See how your apartment compares with the rest of Theater District, or get a market update tuned to this neighborhood — sent to you directly.